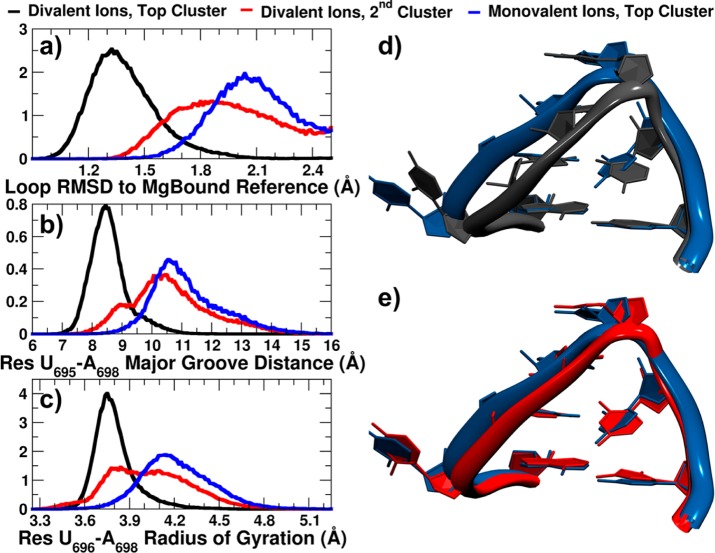
Figure 4.
Differences in top clusters populated in monovalent and divalent ion environments. Normalized histograms of (a) loop RMSD to MgBound reference structure, (b) major groove distance, measured from phosphate atom of residue U695 to phosphate atom of residue A698, (c) radius of gyration of residues U696, G697, and A698 phosphate groups’ center of mass. Overlap of representative structures’ loop regions from (d) top clusters from divalent (black) and monovalent (blue) ion simulations, (e) top cluster of monovalent ion simulations (blue) and second most populated cluster of divalent ion simulations (red) (gatekeeper structures). RNA was fit on stem base pair U695–A701.

