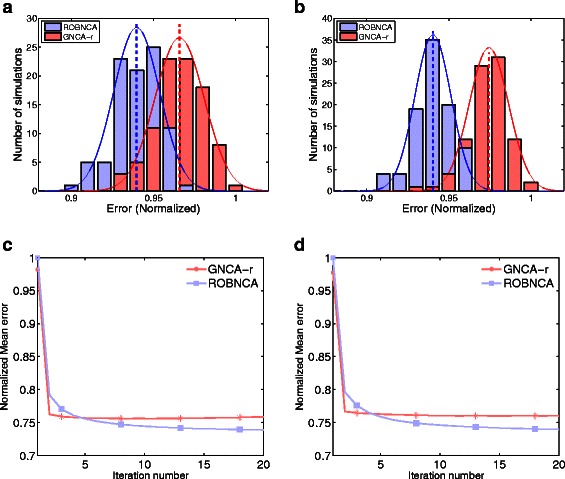
Fig. 4.

ISNCA applied on a real, large biological network. Comparison of the error distributions 100 generated networks of varying sizes (see Table 1 for details) with ISNCA algorithm built on two NCA methods, ROBNCA (blue) and GNCA-r (red) for EGF (a) and HRG (b) microarray data. The errors are normalized for comparison purposes. The mean error over 100 networks is presented as thick dashed lines for both algorithms, blue for ROBNCA and red for GNCA-r. c-d) The convergence properties of the ISNCA with ROBNCA (blue) and GNCA-r (red) algorithms for EGF (c) and HRG (d) data. The mean error over 100 networks was stabilized after 3–4 iterations for ISNCA with GNCA-r and after 10–15 iterations for ISNCA with ROBNCA
