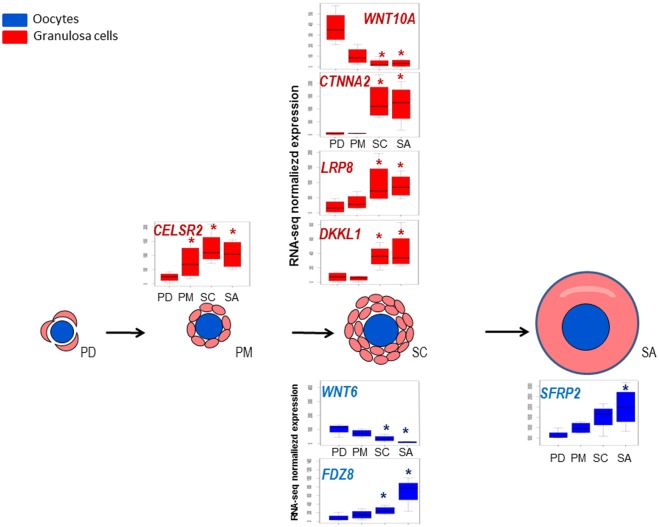
Fig 5. Gene expression profiles of members of WNT signaling pathway during early folliculogenesis.
Significant differences in relative gene expression during early folliculogenesis of members of Wnt signaling pathway (S2 Table). The Y axis corresponds to normalized counts from RNA-seq data. Granulosa cells data are colored in red and oocyte data are colored in blue. *: FDR <0.05, pairwise comparison pval <0.01.

