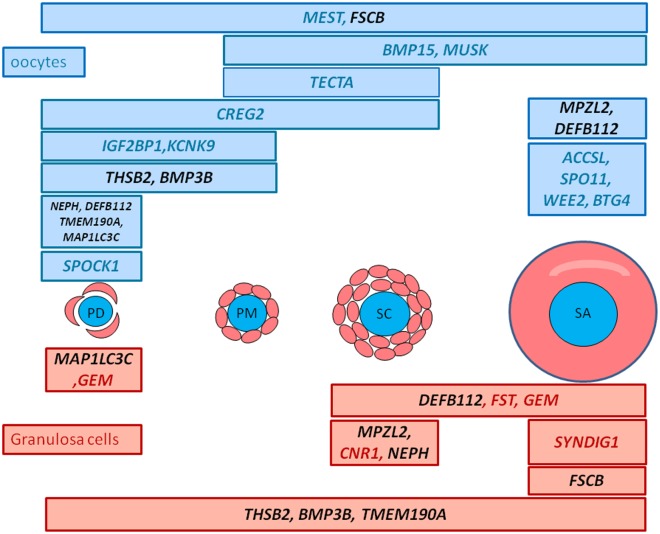
Fig 9. Distribution of the expression of the 24 biomarkers during early follicular development.
These biomarkers correspond to the most strongly expressed genes in a specific cell type and stage (PDO, PMO, SCO, SAO, PDG, PMG, SCG, SAG). They were selected using pairwise comparisons (nbinom Test) comparing each stage to the others including multi-tissue samples (FDR<5% and a fold change >3 for granulosa samples and a fold change >-10 for oocyte samples). Their differential expression was confirmed by qRT-PCR. Gene names marked in red are genes expressed in granulosa cells and gene names marked in blue are genes expressed in oocytes. Gene names marked in black are genes expressed both in oocytes and granulosa cells.

