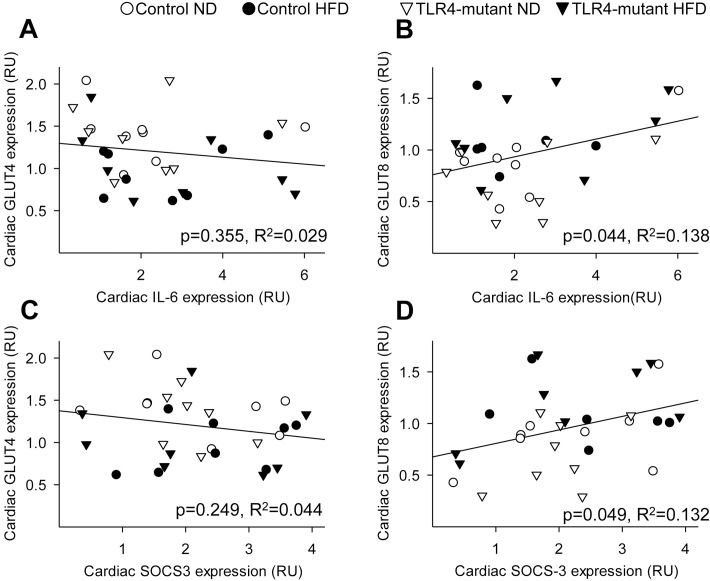
Fig 4. Correlations between pro-inflammatory cytokines and glucose transport in the heart.
(A) Linear correlation between cardiac IL-6 protein expression and GLUT4 protein expression (R2 = 0.029, p = 0.355). (B) Linear correlation between cardiac IL-6 protein expression and GLUT8 protein expression (R2 = 0.138, p = 0.044). (C) Linear correlation between cardiac SOCS-3 protein expression and GLUT4 protein expression (R2 = 0.044, p = 0.249). (D) Linear correlation between cardiac SOCS-3 protein content and GLUT8 protein content (R2 = 0.132, p = 0.049). RU = relative units; HFD = high-fat diet; ND = normal diet. Trendlines show the line-of-best fit for all four groups taken together. n = 6–8 per group.

