Fig. 3.

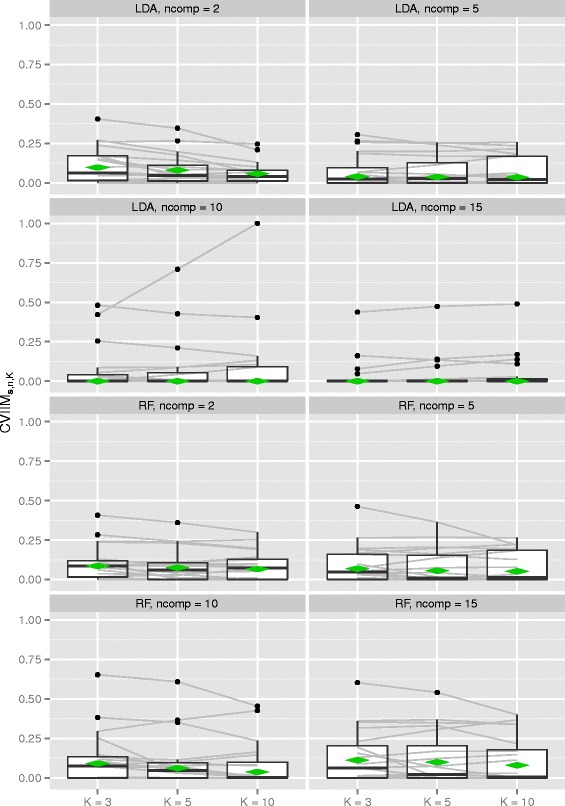
CVIIMs,n,K-values from PCA study. The grey lines connect the values corresponding to the same datasets. The diamonds depict the estimates of global CVIIM

CVIIMs,n,K-values from PCA study. The grey lines connect the values corresponding to the same datasets. The diamonds depict the estimates of global CVIIM