
Fig. 3.
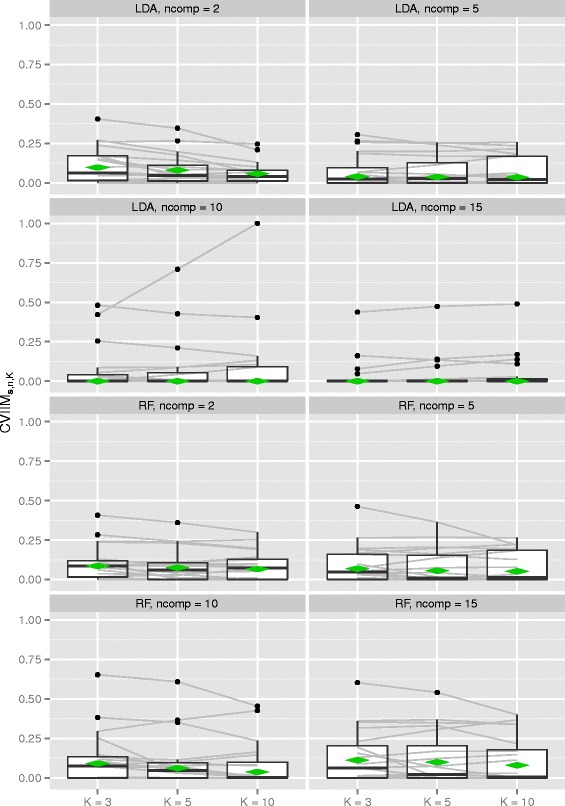
CVIIMs,n,K-values from PCA study. The grey lines connect the values corresponding to the same datasets. The diamonds depict the estimates of global CVIIM
Official websites use .gov
A
.gov website belongs to an official
government organization in the United States.
Secure .gov websites use HTTPS
A lock (
) or https:// means you've safely
connected to the .gov website. Share sensitive
information only on official, secure websites.
CVIIMs,n,K-values from PCA study. The grey lines connect the values corresponding to the same datasets. The diamonds depict the estimates of global CVIIM