
Fig. 4.
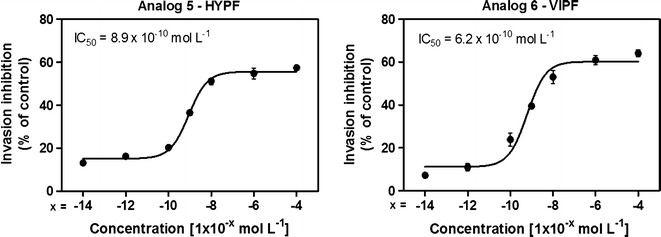
IC50 value for each assay. Peptides 5 and 6 were diluted in seven concentrations [(10−4; 10−6; 10−8; 10−9; 10−10; 10−12; 10−14) mol L−1] giving 7–65 % inhibition. Data have been normalized due difference between control of each assay. The IC50 data were analysed by GraphPad Prism analysis. Parameters: non-linear regression; log (inhibitor) vs response equation was chosen and least square (ordinary) fit method was applied (mean ± standard deviation, n = 2)