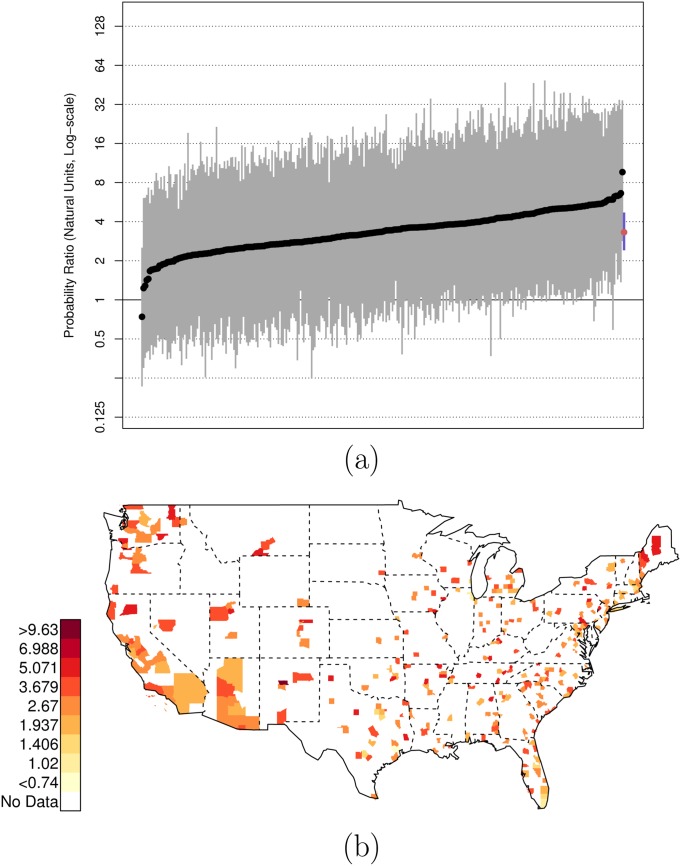
Fig 3. Posterior Random Effects Estimates: Risk Ratio White, Armed-to-Unarmed.
(a) County-by-county posterior estimates of the risk ratio of being {white, armed, and shot by police} to being {white, unarmed, and shot by police}. Grey bars are county-specific 95% PCI estimates. The blue bar is the nation-wide pooled 95% PCI estimate. The points on the error bars are posterior medians. Data are plotted on the log scale, but are labeled on the natural scale. (b) Map of county-specific posterior median estimates of the risk ratio of being {white, armed, and shot by police} to being {white, unarmed, and shot by police}.

