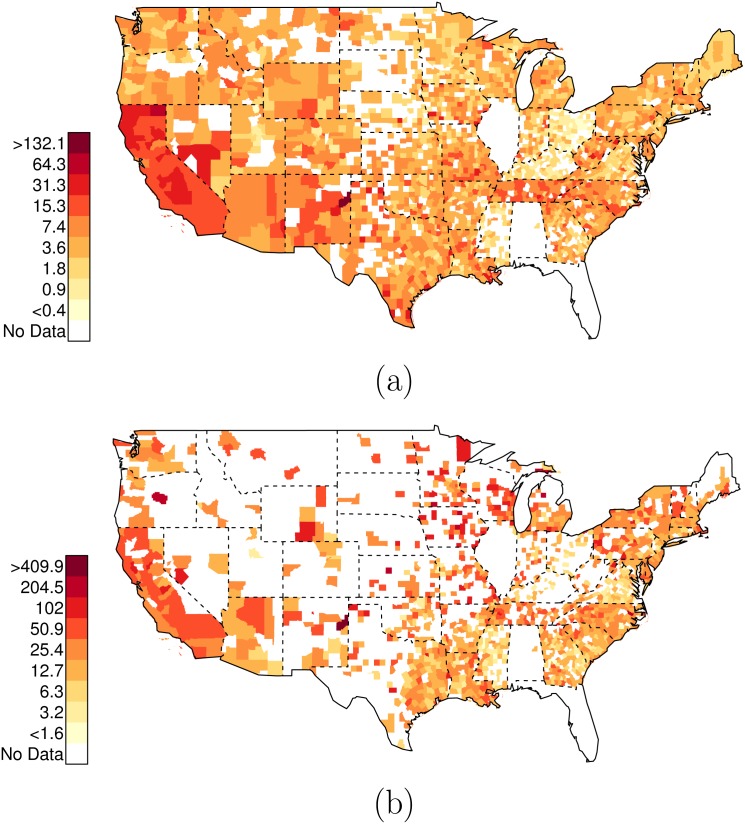
Fig 10. Data on Race-Specific Assault-Related Arrest Rates.
In these figures, only counties with greater than one arrest are plotted. (a) County-specific Department of Justice data on assault-related arrests (White), per 10,000 residents (2012). (b) County-specific Department of Justice data on assault-related arrests (Black), per 10,000 residents (2012).

