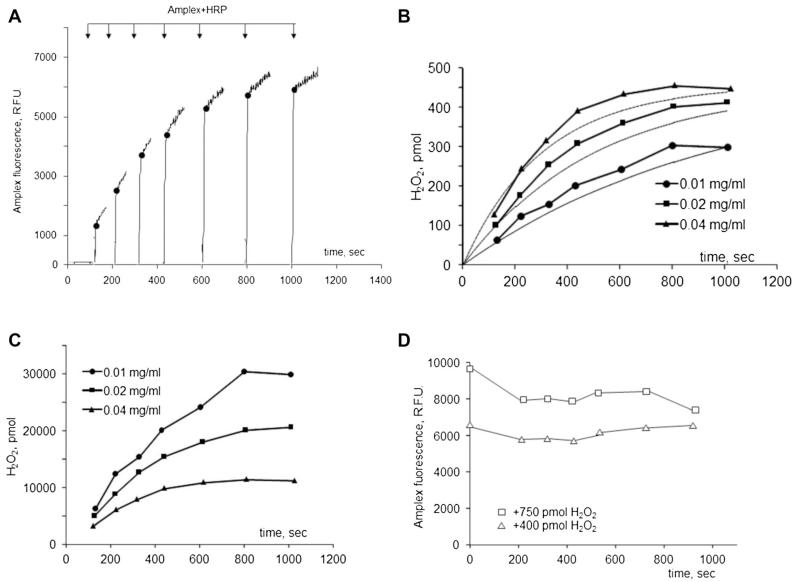
Fig. 2.
H2O2 accumulation and scavenging by mouse brain mitochondira oxidizing succinate. A, typical experiment to estimate ROS accumulation in the medium containing mitochondira oxidizing succinate (see “Methods”). Black circles indicate the data points (the H2O2 amount that was accumulated in the mitochondria suspension at the indicated time) used to construct the graphs presented on panels B and C. B, the H2O2 accumulation dynamics at different concentrations of mitochondria protein. Dashed lines indicate the dynamics of H2O2 accumulation calculated by the Eq. 3 (see the text). C, the data from B after normalizing the amount of H2O2 by the protein content in the assay. D, typical H2O2 scavenging dynamics with succinate-oxidizing mitochondria. White triangles and squares indicate the amount of H2O2 remaining in the assay medium at the indicated time points. The points at “0 sec” were obtained by adding H2O2 to the assay medium in the absence of mitochondria

