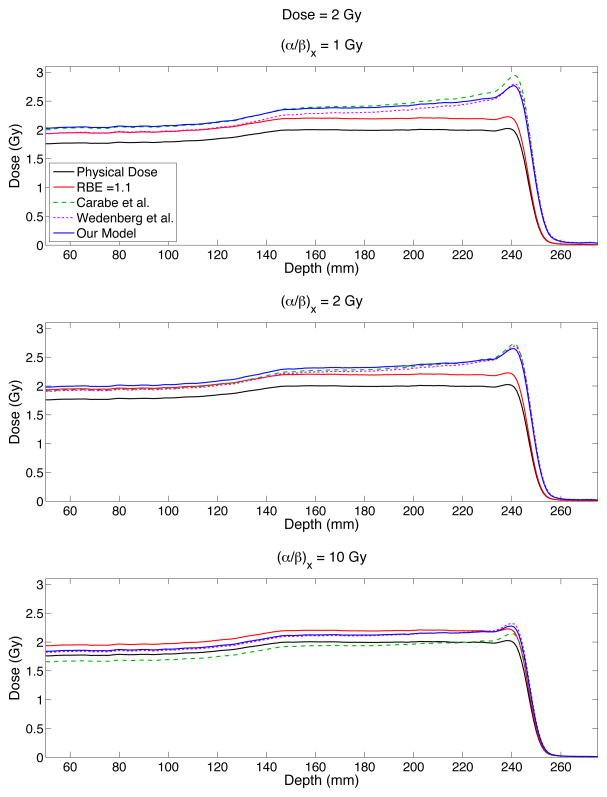
Figure 7.
Predicted biological doses for three different models: Carabe et al. model (green dashed curve), the Wedenberg et al. model (pink dotted curve) and our model (blue solid curve) for a simulated spread out Bragg peak (SOBP) with a modulation width of 10 cm and a range of 25 cm. The physical dose is shown by the black solid curve while the red curve shows the physical dose scaled by a constant value of 1.1.

