
Figure 2.
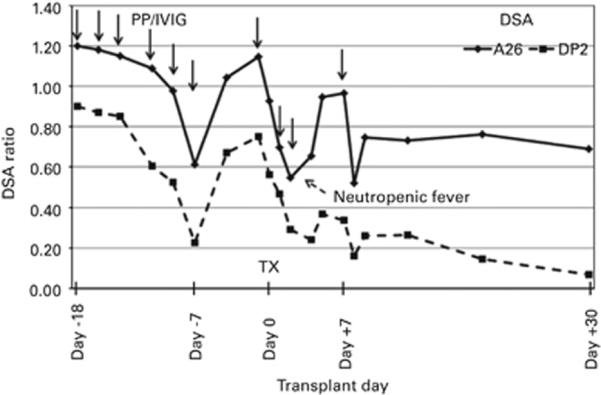
The desensitization course for patient no. 13 who had DSA to HLA-A26 and -DP2. The trend of the DSA to HLA-A26 is illustrated by the solid line and the DSA to HLA-DP2 is shown as a dashed line. The DSA values are given as ratios of the MFI values normalized to their respective positive controls. The solid arrows indicate the timing and number of PP/IVIG treatments and the dashed arrow indicates when the patient experienced a neutropenic fever.