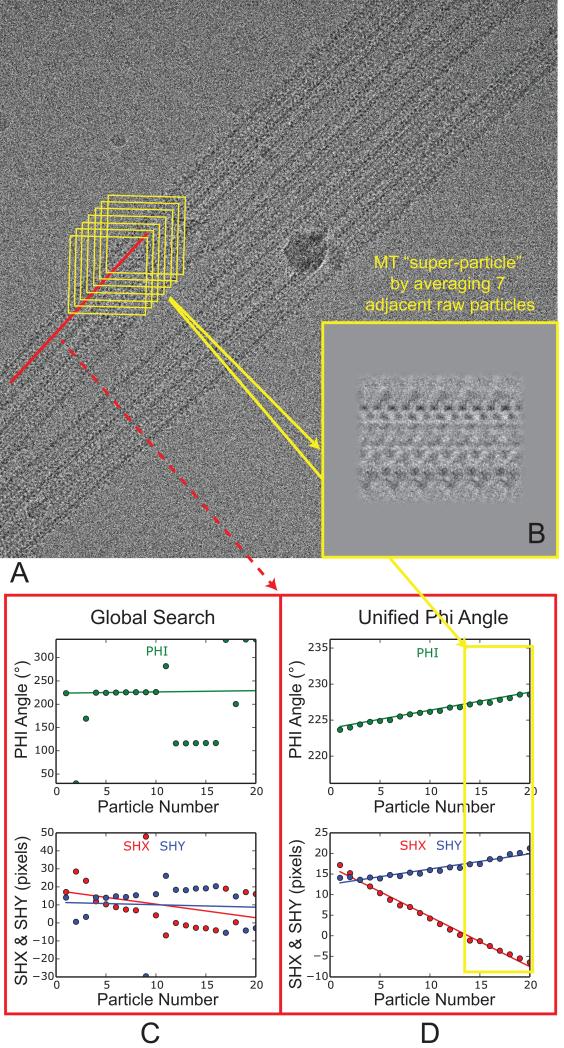
Fig. 3.
Procedure to compute MT super-particles. (A) A typical cryo-EM image of EB3-GTPγS MT, after drift correction. The red line corresponds to one MT selection, which was cut into overlapping boxes in yellow. The non-overlapping region between adjacent boxes is set to be 80 Å, which corresponds approximately to the tubulin dimer repeat. (B) The insert shows an averaged MT super-particle from the seven particles in the yellow boxes in (A). (C) Plots of φ angle and x, y translations (shx and shy) for all the 19 particles from the same MT (red line in (A)). (D) Plots of φ angle and x, y translations for the same set of particles after enforcing a consistent φ angle (unifying φ). This set of alignment parameters (φ, shx and shy) were used to compute three non-overlapping MT super-particles. One of them, calculated from the seven particles (indicated by the yellow rectangle), is shown in (B).

