Fig. 6.
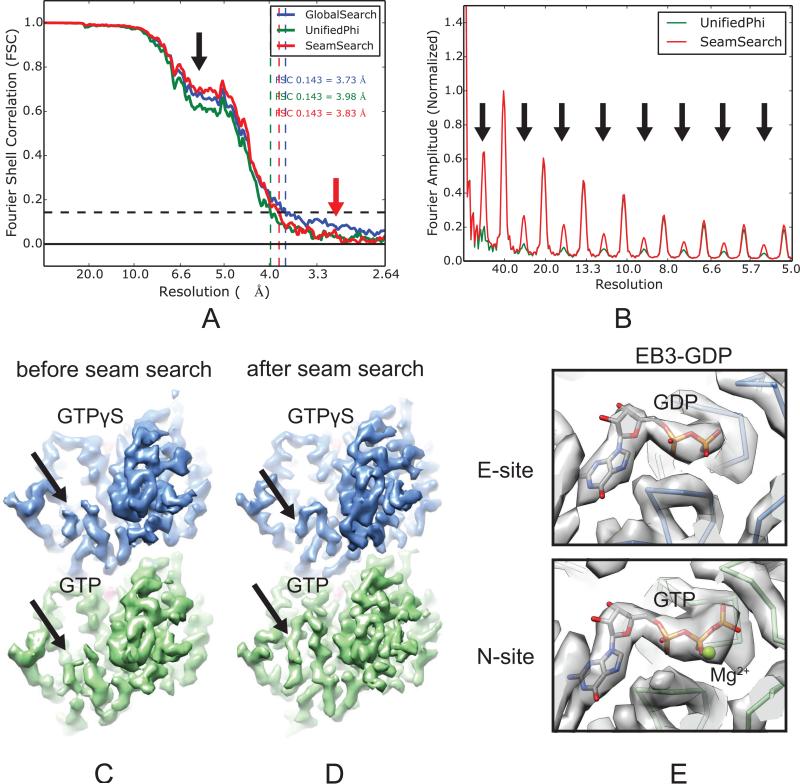
The seam-search protocol improves the distinction of [g302]- and β-tubulin in the symmetrized MT reconstructions. (A) Plot of FSC curves of symmetrized reconstructions of the EB3-GTPγS MT state at three different data processing stages. (B) Layer line profile of the reconstruction before and after seam-search. (C and D) Cryo-EM densities of the EB3-GTPγS MT before (C) and after (D) seam-search, showing the difference in the S9-S10 loop between α- and β-tubulin (black arrows). α- and β-tubulin are colored green and blue, respectively. (E) Cryo-EM densities and atomic models for the EB3-GDP MT showing the difference of nucleotides bound at the E-site (GDP) and the N-site (GTP and Mg2+).

