
Fig. 2.
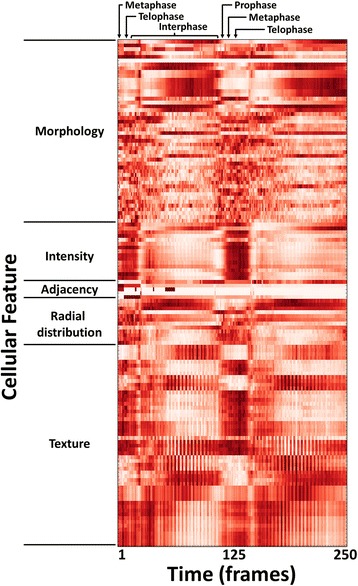
Heatmap of high-content cellular time-lapse measurements. The per-nucleus measurements from a Drosophila time-lapse movie are averaged over all nuclei for each timepoint; the measurements were collected by CellProfiler software. Feature values were normalized from 0 to 1 for visualization purposes. Feature names were omitted for conciseness but are provided in the Tracer display; the features shown are listed in order in the Additional file 3: Table S1, and are further described in the CellProfiler documentation