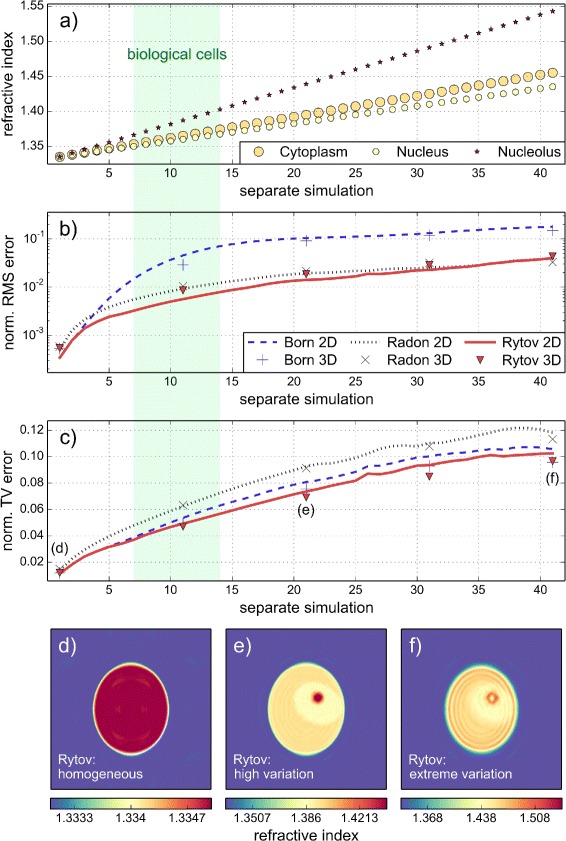
Fig. 4.

Dependence of reconstruction quality on the refractive index variation. a The refractive index values of the cell phantom range from 1.334 to 1.455 (cytoplasm), 1.435 (nucleus), and 1.543 (nucleolus) in a linear fashion. The approximate range of the refractive index for biological cells is marked in green. The refractive index of the medium is 1.333. b Normalized root mean square (RMS) error in dependence of the refractive index values shown in (a). c Normalized total variation (TV) error in dependence of the refractive index values shown in (a). d, e, f Cross sections of the 3D refractive index reconstruction with the Rytov approximation. The three simulations are labeled in (c). The diameter (2a=17 λ) of the cell phantom and the total number of projections (200) are unchanged for all simulations
