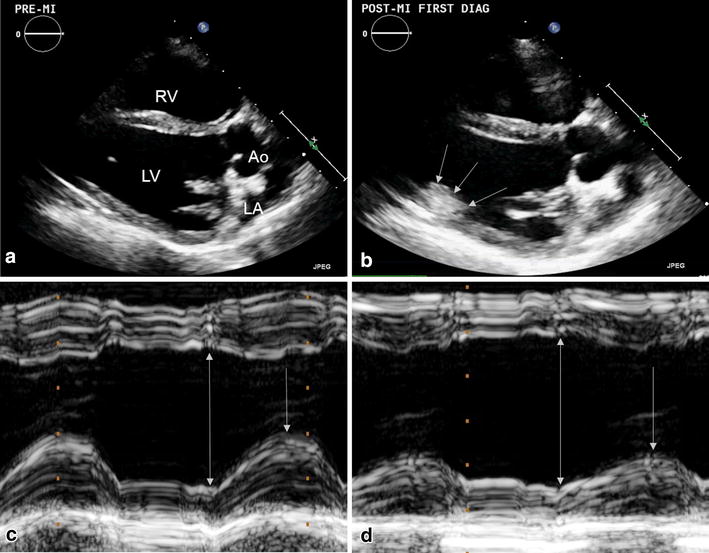
Figure 2.

Two-dimensional (2D) and M-mode echocardiography prior to and following D1-LAD occlusion. Echocardiography was performed prior to (a) and following D1-LAD occlusion. Occasionally, the presence of the infarct could be seen as a hyperechoic amorphous mass on 2D images, associated with the left ventricular posterior wall and anterolateral papillary muscle, shown here outlined by arrows (b). Compared to pre-MI M-mode images (c), there was an appreciable decrease in systolic excursion of the left ventricular posterior wall following D1-LAD occlusion (d). The double arrows represent the left ventricle at its maximal diastolic diameter, while the single arrows represent the maximal systolic excursion of the LV posterior wall.
