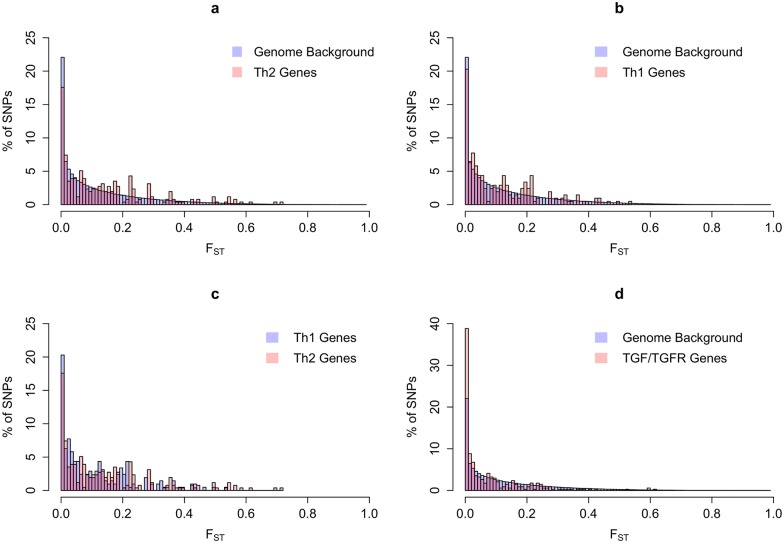
Fig 2. Pattern of differences between YRI and CEU HapMap populations, as determined by Fst between SNPs.
(A) Th2 variants compared to background (18 genes and 256 SNPs); (B) Th1 variants compared to background (14 genes and 207 SNPs); (C) A comparison of Fst values for Th2 as compared to Th1 SNPs); (D) TGFβ and TGFβ-receptor variants, as compared to background (6 genes and 340 SNPs). Fst was calculated using the method of Weir and Cockerham [169] and varies from zero (when two populations have identical allele frequencies of a given SNP) to one (when they are fixed for different alleles). Genes used for these analyses are listed in S1 Table.

