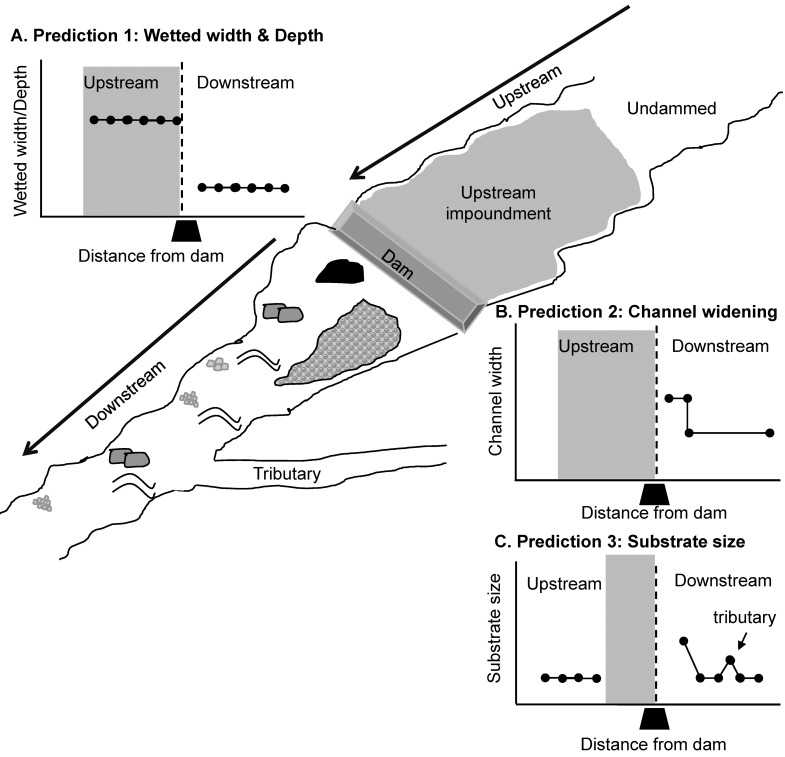
Fig 1. Predictions about Dam Impact.
Predictions of geomorphic effects caused by low-head dams on (A) wetted width and depth, (B) channel widening, and (C) substrate size from the Web of Science literature on low-head dams. On all prediction plots, the X axis is the distance from the dam, the black trapezoid represents dam position, the area left of the dashed line represents habitat upstream of the dam and the area right of the dashed line represents habitat downstream of the dam. The impoundment is represented by grey shading.

