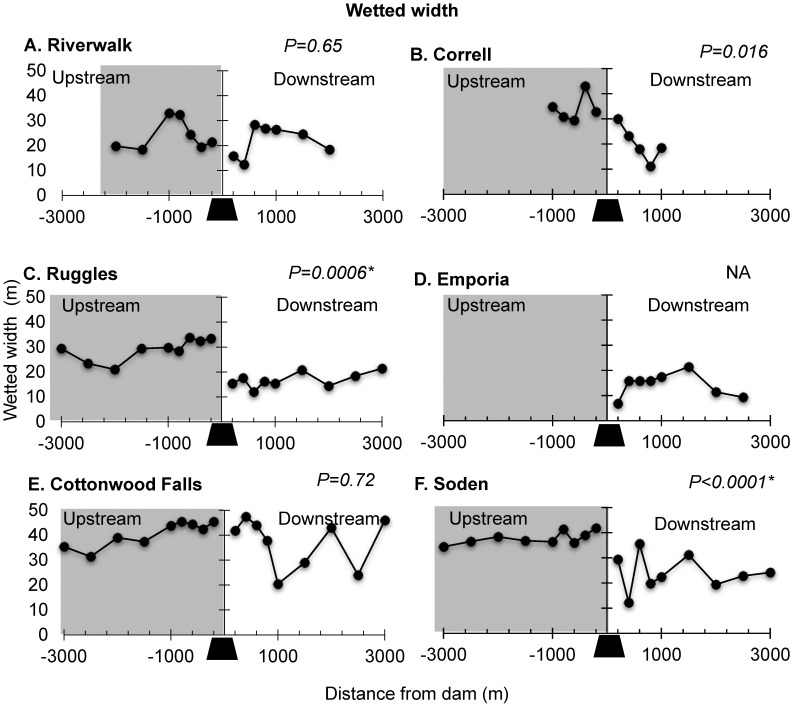
Fig 4. Wetted Width.
Longitudinal profiles of wetted width for the six dams in the study reach showing upstream (left) and downstream (right) samples for our six study dams (black trapezoid); (A) Riverwalk, (B) Correll, (C) Ruggles, (D) Emporia, (E) Cottonwood Falls, and (F) Soden. Y axis arrows indicate mean wetted width. Small arrows in panel indicate footprint based on substrate size profiles see section on substrate size for details. P-values from Wilcoxon rank sum test for mean differences between upstream and downstream transects are shown. Asterisk indicates significance with Bonferroni corrected α = 0.01 (0.05 divided by five dams).

