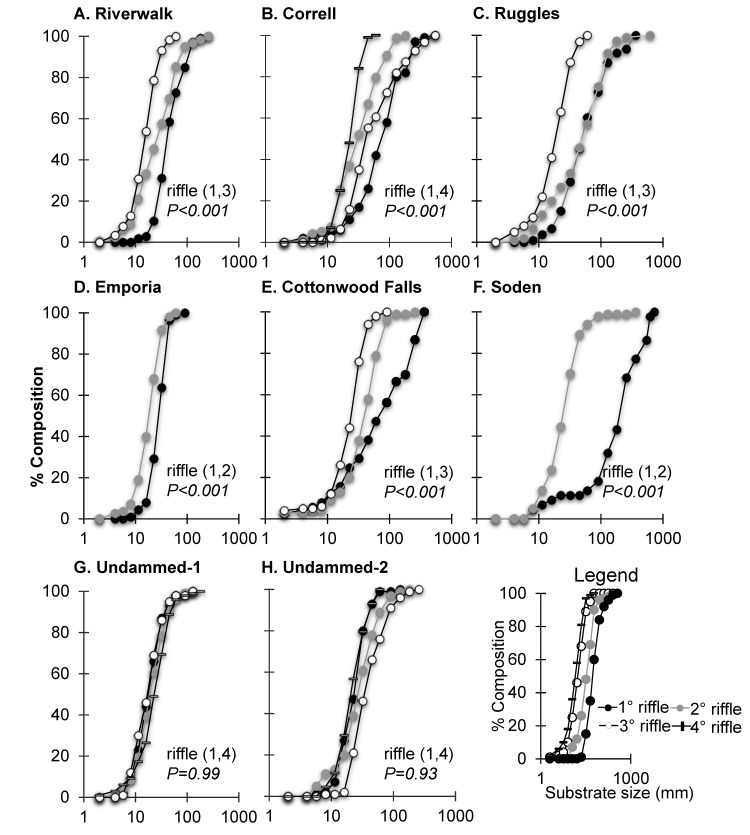
Fig 7. Cumulative Distribution Curves.
Upper panels display substrate size composition changes with increasing distance from dams for (A) Riverwalk, (B) Correll, (C) Ruggles, (D) Emporia, (E) Cottonwood Falls, (F) Soden, and undammed sites (G) Undammed-1 and (H) Undammed-2. Consecutive riffles below the dam are displayed until median substrate size (D50) returned to 22.5 mm for Neosho River or 32 mm for Cottonwood River. For comparison, lower panels display substrate size compositions for riffles at reference sites located away from dams where distributions remained similar. Note: reference sites with riffles were not available for four of the six dams. P-values in the figures are based on Kolmogorov-Smirnov test of the distribution curves comparing the two riffles indicated in parentheses. See panel I for the legend—1° riffle indicates the first riffle downstream of a dam, 2° riffle indicates the second riffle downstream of a dam, 3° riffle indicates the third riffle downstream of a dam.

