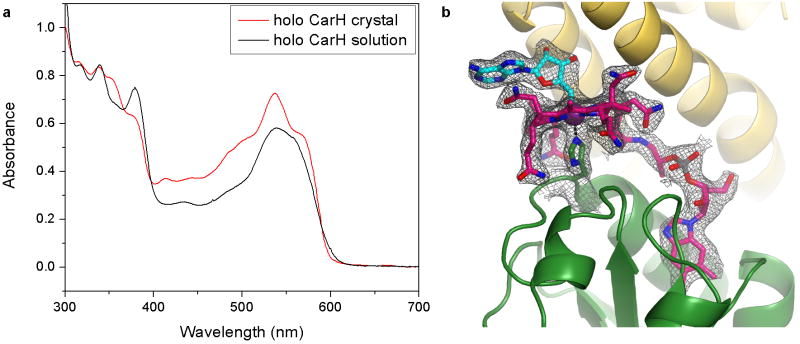
Extended Data Figure 1.
CarH crystals contain intact AdoCbl. (a) UV-Vis spectra obtained from AdoCbl-bound CarH crystals at T=100 K (red trace) or AdoCbl-bound CarH in solution at T=298 K (black trace) exhibit good qualitative agreement and similar features, including a peak centered around 540 nm with a shoulder around 560 nm. Because many band intensities are orientation-dependent and the crystal spectrum changes with orientation but molecules are rotationally averaged in solution, quantitative comparison of the spectra is difficult. Note also that individual bands appear sharper in the crystal spectrum because the molecules have fewer rotational degrees of freedom and because fewer vibrational states are populated at T=100 K. (b) Simulated annealing composite omit electron density contoured around AdoCbl at 1.0 σ (gray). The electron density covers the entire AdoCbl molecule including the Co-C bond, indicating that the Co-C bond remained intact during crystallization and data collection. AdoCbl is shown in stick representation with Cbl carbons in pink and 5′-dAdo group carbons in cyan. Co is shown as a purple sphere. The Co-coordinating His177 is shown in sticks with carbons in green. CarH shown in ribbons with helix bundle in yellow and Cbl-binding domain in green.

