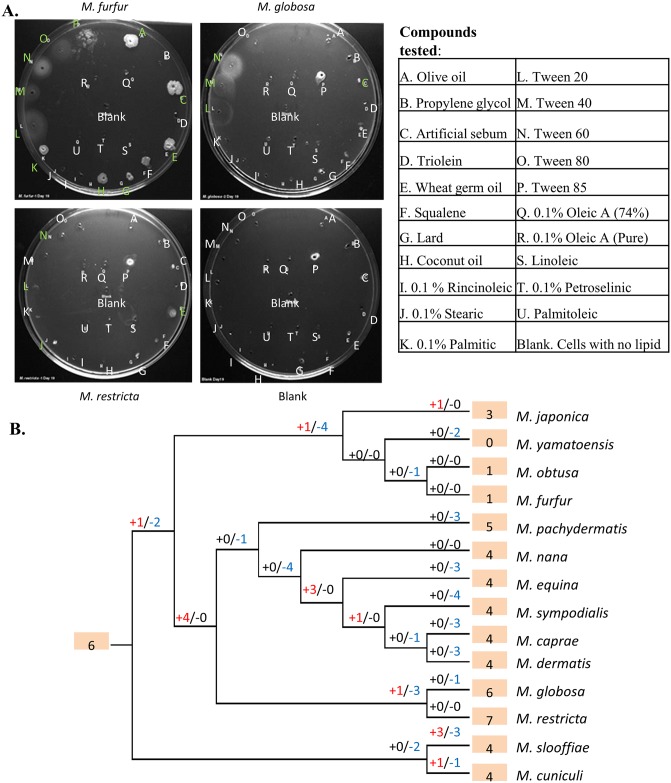
Fig 5. Lipid specificity and extensive turnover in the lipase gene family.
A) Representative lipid assimilation assay images. Letters correspond to lipid wells (S5 Table). White letters indicate no growth, while green letters indicate growth on visual scale. B) Gene gains and losses in phosphoesterase family PF04185, where “+” indicates the number of gene gain events while “-” indicates the number of gene loss events. Shaded numbers indicate the estimated gene copy number in the most recent common ancestor and gene copy numbers in the observed species.

