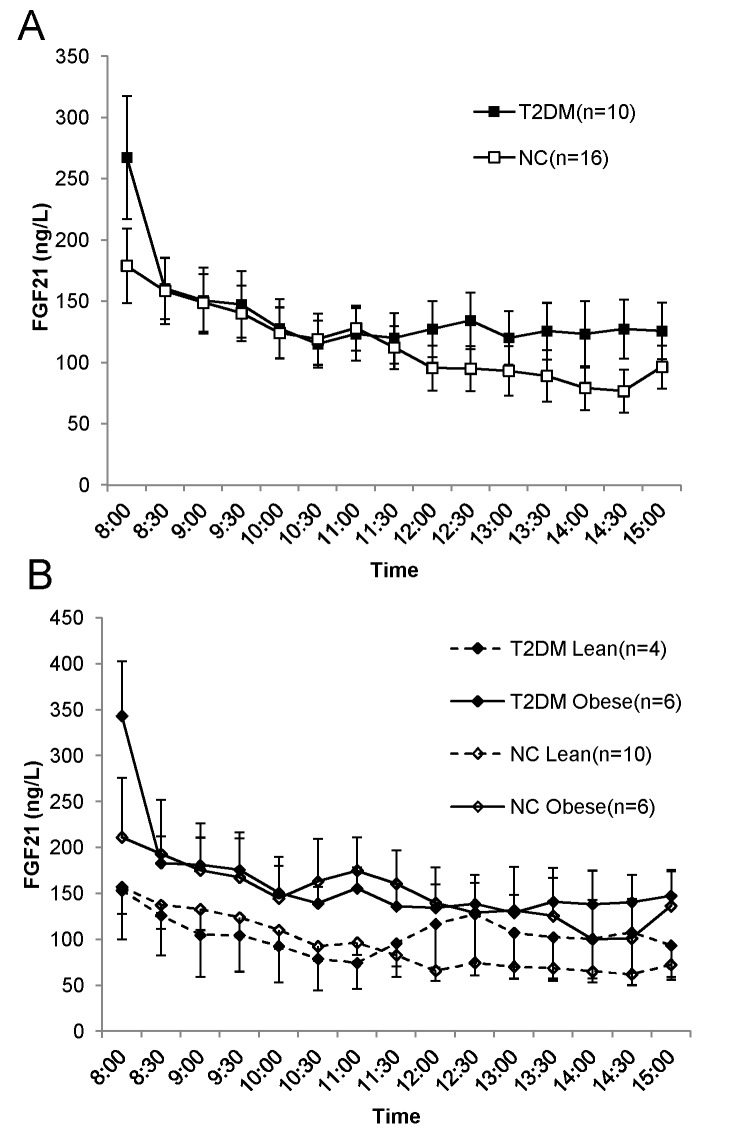
Fig 1. The profiles of FGF21 over 7 hr in subjects with and without T2DM.
(A), the comparison of profiles of FGF21 between T2DM and NC. Black squares represent T2DM patients; white squares represent healthy controls. (B), the comparison of profiles of FGF21 between subgroups stratified by BMI in subjects with and without T2DM. Black diamonds represent T2DM patients; white diamonds represent normal controls; solid lines represent obese subjects; dashed lines represent lean subjects. Blood samples were drawn every 30 min from participants who received 2 standardized meals (breakfast: 8 am; lunch 11 am). Data are shown as mean ± SEM.

