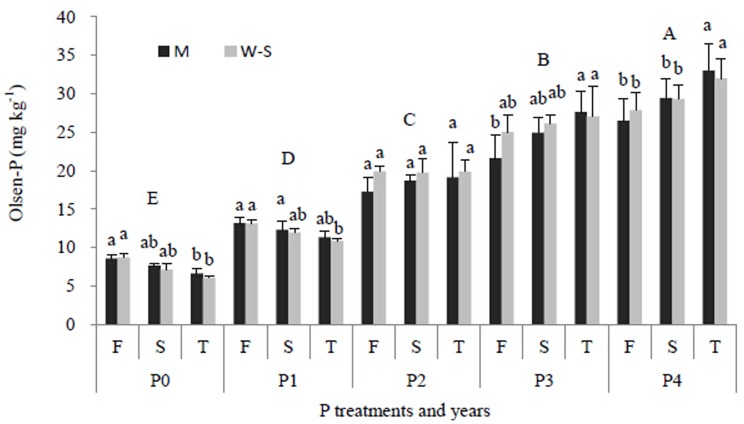
Fig 7. Soil Olsen-P in the top 20 cm layer of the maize strip at maize harvest (M) and the wheat-soybean strip at soybean harvest (W-S) in the W/M/S system as affected by P application rates each year.
Different lower-case letters indicate significant difference (P<0.05) by LSD between different years under the same P application rate. Different capital letters indicate significant difference (p<0.05) by LSD between different P application rates. F = the first year (2011), S = the second year (2012), T = the third year (2013). P0, P1, P2, P3, P4 indicate the P treatments (as in table 2). Each value was the mean ± SE. Bars indicate standard errors.

