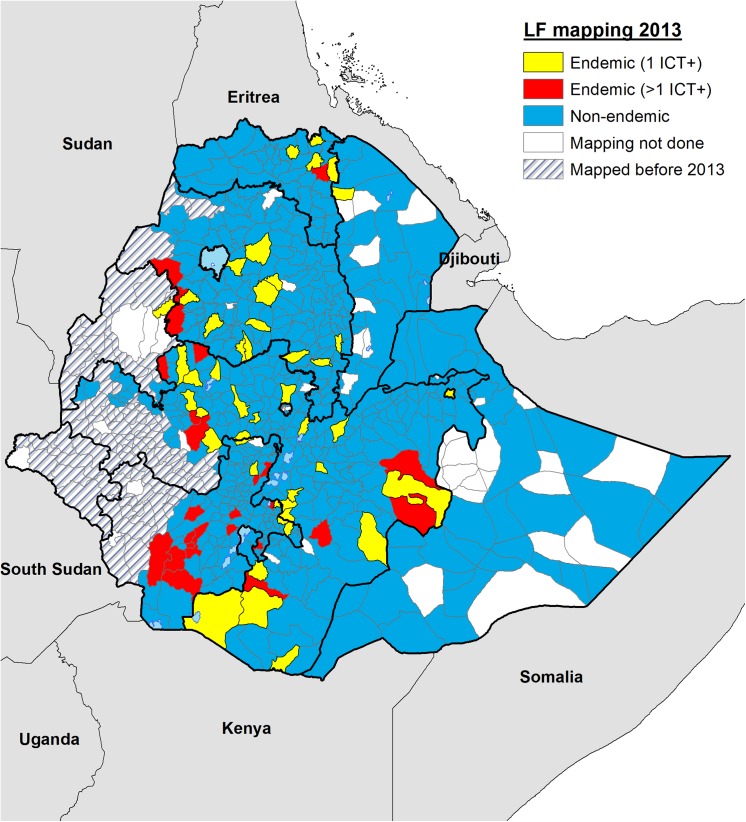
Fig 2. Map showing the distribution of endemic and non-endemic implementation units (UIs) or woredas identified during the 2013 mapping surveys in Ethiopia.
After completing surveys in 658 implementation units, 75 were classified as endemic based on finding at least one infected person after testing approximately 200 individuals in two different communities. Forty-five of the endemic IU, shown in yellow had borderline endemicity with only one CFA positive person identified (1 ICT+). The 30 IUs with two or more CFA positive individuals (>1 ICT+) are shown in red.

