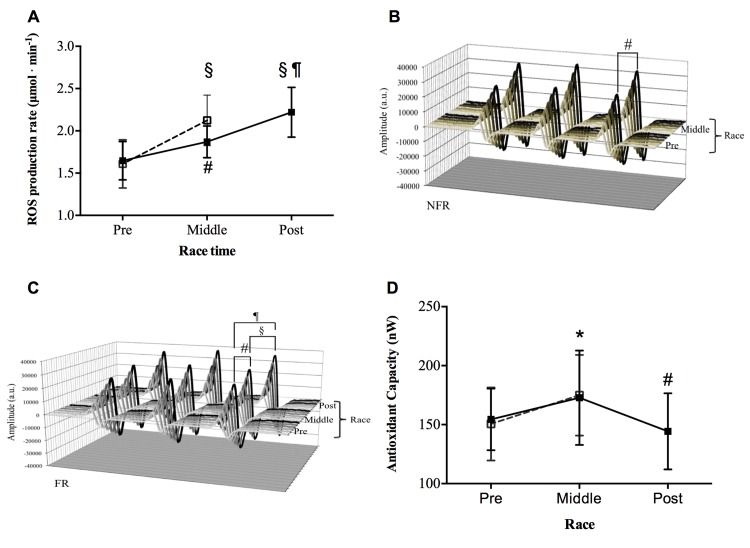
Fig 2. Effects of MUM on ROS Production and Antioxidant Capacity.
The data obtained in the two groups of athletes are shown: FR (closed symbols), NFR (open symbols). Results are expressed as mean ± SD. Time course of: A) ROS production rate (μmol.min-1) detected by EPR technique before (Pre), at Middle and immediately Post race. Changes over time were significant compared to pre competition in both groups (# symbol, P<0.01 and § symbol, P<0.001); in the FR group: Pre with respect to Post-Run P<0.0001 (¶ symbol); Middle with respect to Post-Race P<0.001 (§ symbol). Examples of the stacked plots of the EPR spectra recorded: B) at Pre, and Middle Race collected from a NFR subject and C) at Pre, Middle and Post-Race in a FR subject. In each panel the increase of the signal amplitude (a. u.) is shown. The differences between Pre vs Midlle-Race (# symbol, P<0.01), Middle versus Post-Race (§ symbol, P<0.001) and Pre versus Post-Race (¶ symbol, P<0.0001) are indicated. D) Time course of the antioxidant capacity (nW) before (Pre), at Middle and immediately Post-Race. In the FR group, the changes over time were significantly different (* symbol, P<0.05) at Middle with respect to Post-Race and (# symbol; P<0.01;) with respect to Pre-Race. In Panels A and D, the lines are drawn to guide the eye.

