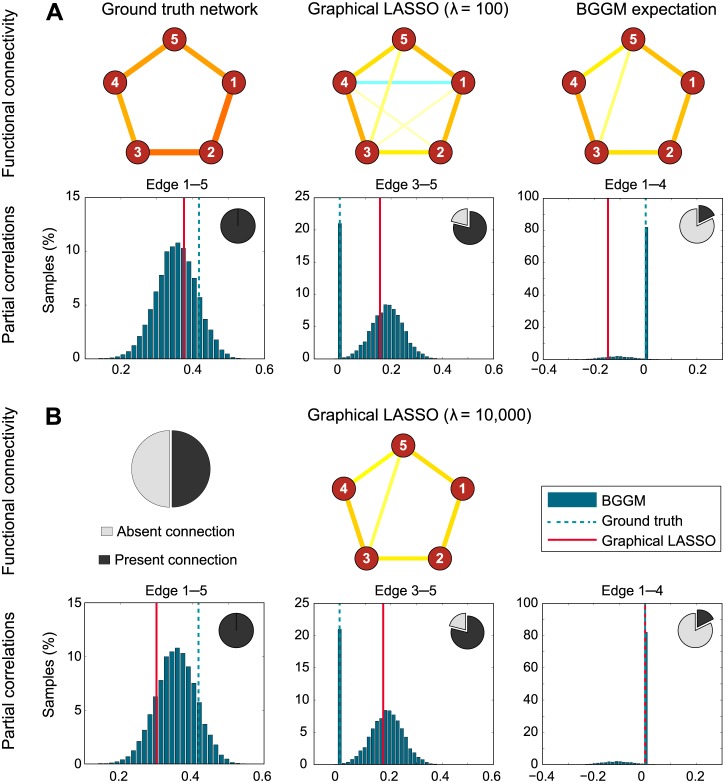
Fig 4.
A. Simulation details. First row: the ground truth connectivity of one run of simulation 1, as well as the constructions by the graphical LASSO (λ = 100) and the expectation of the Gaussian graphical model approach. Second row: estimated partial correlation for a true positive connection, a true negative connection with strong empirical correlation, and a true negative connection with weak empirical correlation. B. The same, but with stronger regularization for the graphical LASSO (λ = 10, 000). This time, the G-LASSO estimate is similar to the BGGM expectation for connection 1–4, but over-regularizes the true positive connection 1–5.

