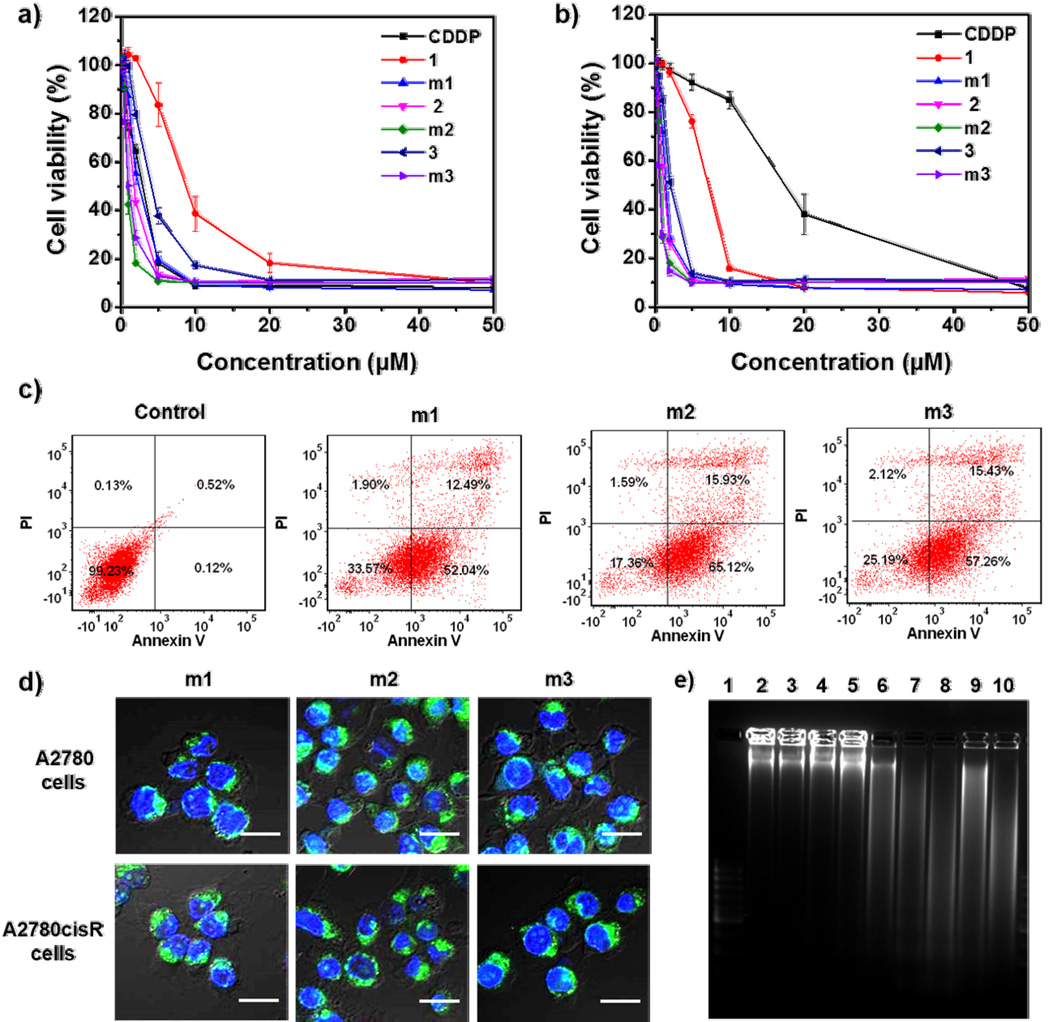
Figure 3.
Cytotoxicity of complexes and micelles against A2780 cells a) and A2780cisR cells b). The cells were incubated with free CDDP, complexes 1–3, or m1–m3 for 48 h followed by the MTS assay. c) Annexin V/PI analysis of A2780cisR cells after incubation with m1–m3 for 48 h. The quadrants from lower left to upper left (counter clockwise) represent healthy, early apoptotic, late apoptotic, and necrotic cells, respectively. The percentage of cells in each quadrant was shown on the graphs. d) CLSM images showing cell apoptosis in A2780 and A2780cisR cells after incubation with m1–m3 for 48 h. Cells were stained with Alexa Fluor 488 conjugated Annexin V and the nuclei were stained with DAPI. Scale bars: 50 µm. e) Analysis of DNA ladder on 2% (w/v) agarose gel at 35 V for 3 h after DNA extraction from the A2780cisR cells treated with complexes and micelles. Lanes 1–10: DNA marker, control, PEG-b-p(Glu) copolymer, CDDP, 1, m1, 2, m2, 3, and m3, respectively.

