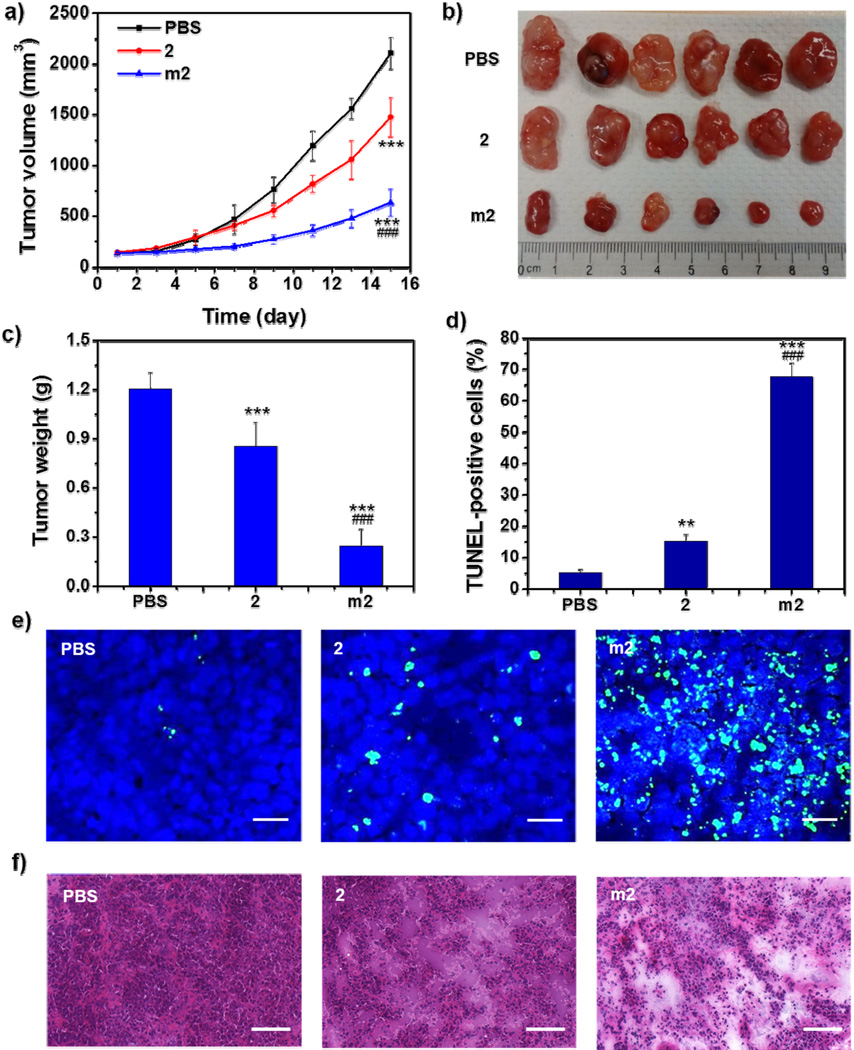
Figure 4.
In vivo anticancer effect of m2 on the A2780cisR subcutaneous xenograft. a) Tumor growth curves of the mice receiving intravenous injection of PBS, 2, or m2 (n = 6). b) Photograph of the excised tumors on day 15. c) Weights of the excised tumors on Day 15 (n = 6). d) The percentage of TUNEL-positive cells in tumor tissues (n = 3). e) Representative CLSM images of TUNEL assays of tumor tissues. DNA fragment in apoptotic cells was stained with fluorescein-conjugated deoxynucleotides (green) and the nuclei were stained with DAPI (blue). Scale bars: 50 µm. f) Representative images of histological assays of tumor tissues. Scale bars: 100 µm. Statistical significance: **P < 0.01 and ***P < 0.001 compared to the control group (PBS), ###P < 0.001 compared to the 2-treated group.

