Figure 2.
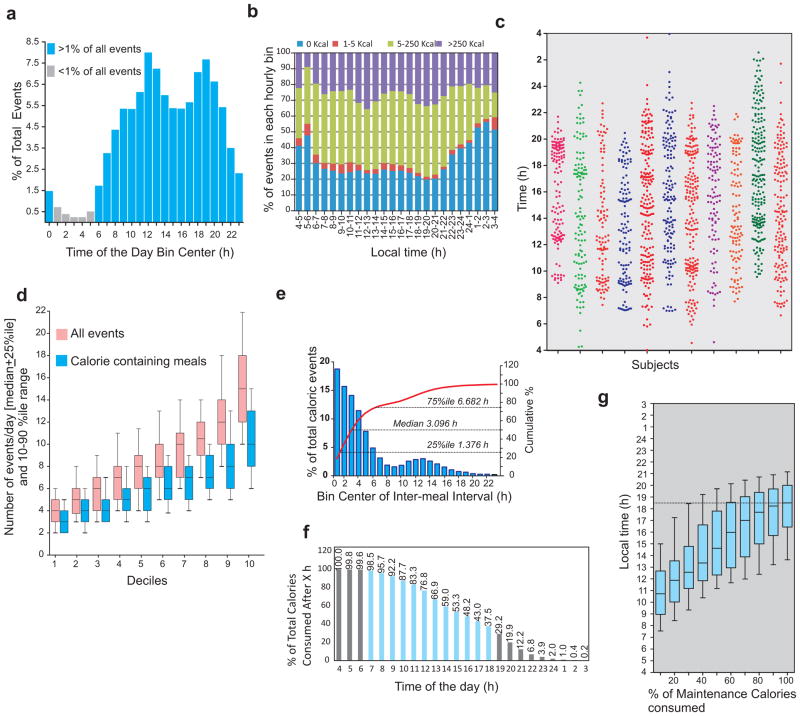
Human eating lacks 3-meals-a-day structure. (a) Percentage of all ingestion events in 1 h bin shows the nadir at 4 am. (b) The fraction of events with <5kcal also reaches its peak at 4am. Therefore we considered 4 am (instead of the midnight) as the beginning of the metabolic day. (c) Representative scatter plot of ingestion events of 11 subjects during the observation period shows the lack of clustering of events into three principal bins for most individuals and a large variation in the total number of events. (d) Number of ingestion events/day in all subjects binned into 10 deciles show a wide distribution of number of total and calorie containing events every day. (e) Frequency distribution and cumulative frequency of inter-meal-interval for the entire cohort. (f) Percentage of calories remaining to be consumed in each hourly bin shows >75% of all calories are consumed after mid-day. (g) Time (median + 25%–50% range and 10–90% interval) at which percentage of maintenance calories consumed in 10% increments are shown.

