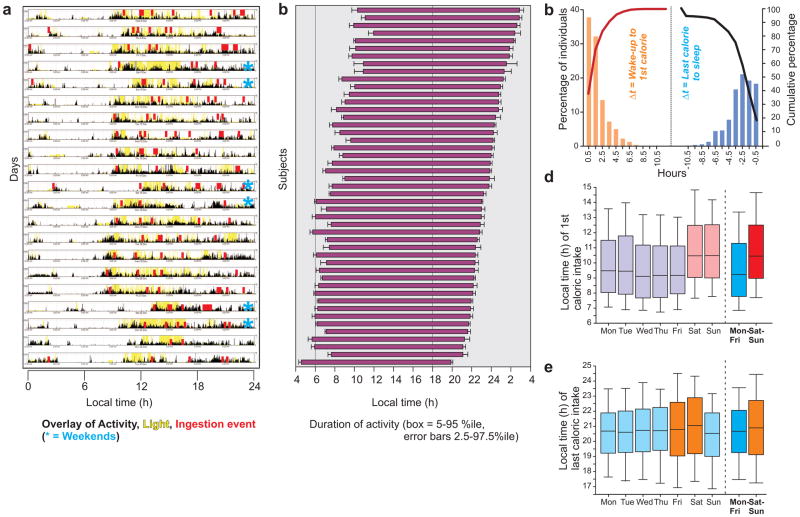
Figure 3.
Activity and eating duration in adult humans. (a) Representative actogram and light exposure pattern (from a wrist-worn device) of a subject for 3 weeks overlaid with ingestion events (from smartphone app) shows that the latter occur erratically throughout the active period. (b) Wakeful activity duration in a subset of the subjects is shown. Each horizontal bar shows the interval between average wake up and bedtime (+ s.e.m., up to 21 days of monitoring). (c) Time interval between waking up and the first caloric ingestion or the last caloric ingestion and going to bed. Bars (orange and blue, y-axis) indicate the percent of the individuals for whom actigraphy was performed with the indicated number of hours (x-axis, 1 h bins) from waking up to the first caloric intake or from the last caloric intake to sleep. Cumulative percentages (secondary y-axis) are shown in color-matched lines. Median time of (d) first and (e) last caloric event of all individuals on different days of the week. Median (25–75% interval in box, 10–90% interval in lines) local time is shown.

