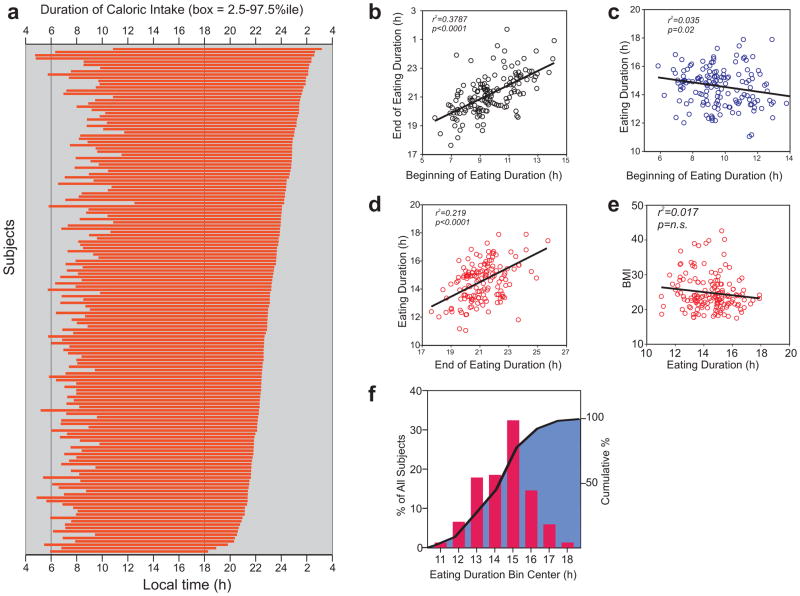
Figure 4.
Daily duration of caloric intake.
(a) Eating duration of all individuals is shown in the order of late (top) to early (bottom) nighttime fasting onset time. (b) The time of last caloric intake weakly positively correlates with the time of first caloric intake. (c) The daily duration of eating does not correlate with the time of first caloric intake (d) but weakly positively correlates with the time of the last caloric intake. The subjects’ daily eating duration does not correlate with their (e) body mass index (BMI, kg/m2) (f) Frequency distribution (red bars) and cumulative percentage (black line and blue filled area) of eating duration (hours).

