Figure 5.
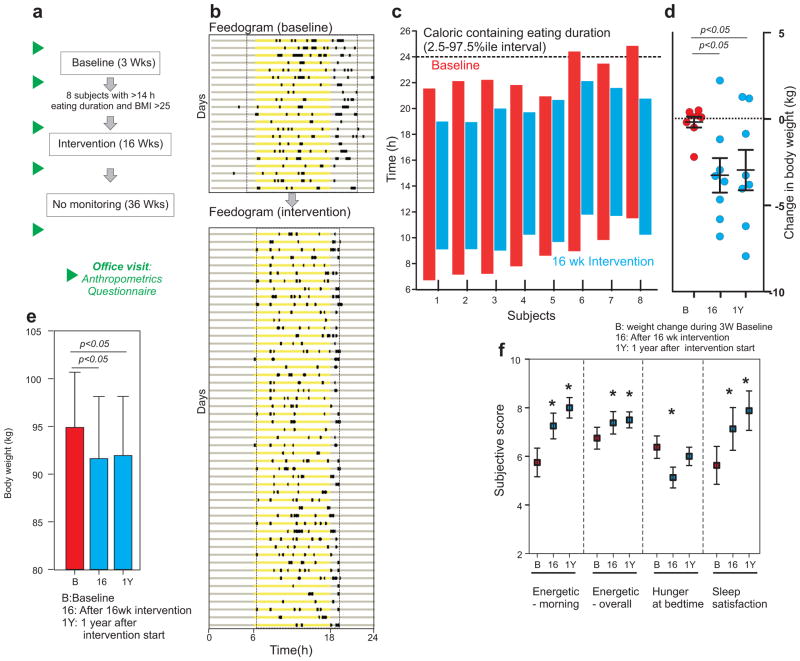
Improved eating pattern reduces body weight in healthy overweight individuals. (a) Schematic of the study design to test the effect of eating pattern on body weight. (b) Representative “feedogram” of a participant during baseline and during intervention. The times of ingestion events are denoted as prominent black rectangles along the 24 h day represented in each horizontal line (x-axis). Yellow represents the time between 6 am and 6 pm. Eating duration during baseline and intervention are shown as broken lines. (c) The daily eating duration of each individual during baseline (red) and intervention (blue) plotted against the local time (y-axis). (d) Scatter plot and average (± s.e.m.) change in body weight in 8 participants during 3 weeks of baseline monitoring, after 16 weeks of intervention and after 1 year. (e) Average (+ s.e.m.) body weight at the end of 3 weeks baseline, after 16 weeks of monitored intervention and at 1 y. (f) Average (+ s.e.m.) of subjective measures of energy level, hunger and sleep in subjects. These subjective measures were assessed on a scale of 1 to 10, with 10 being the preferred (healthier) end of the range. Higher numbers thus indicated healthier values for the quantity, i.e., more energetic, less hunger at bedtime and more sleep satisfaction. *: p<0.05, T-test.

