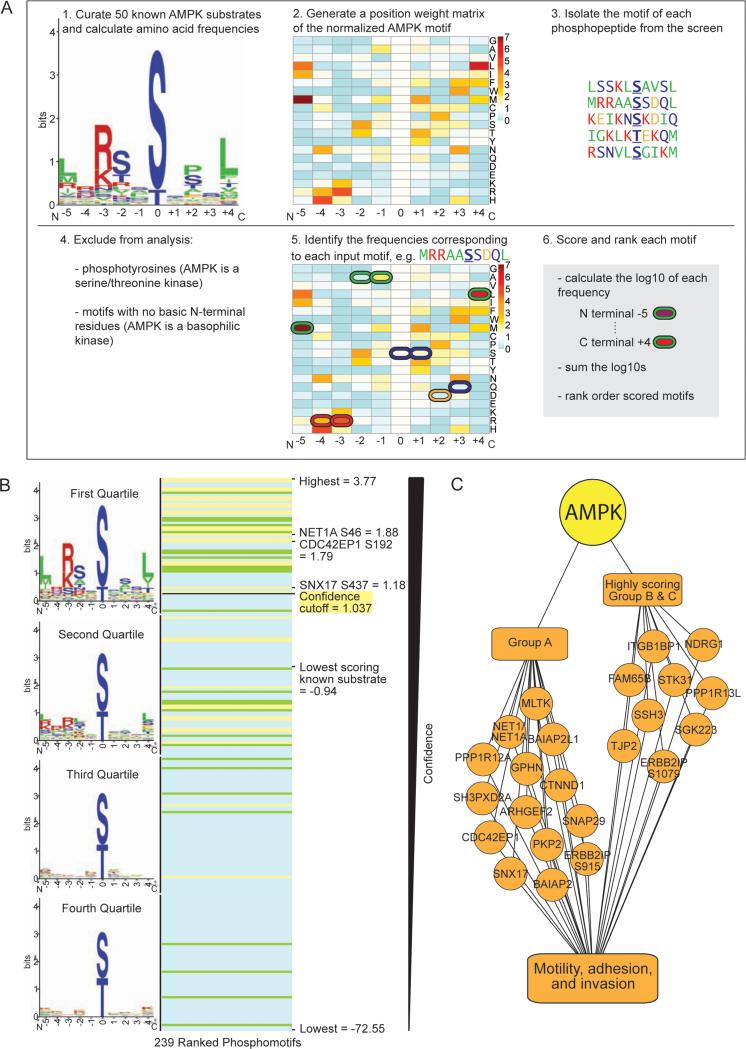
Figure 6. Use of the AMPK phosphorylation motif to rank phosphorylation sites identified at low frequency in the screen.
(A) Schematic of the pipeline used to score resemblance to the AMPK phosphorylation motif. The logo motif (1.) represents the phosphorylation motif of 50 known in vivo AMPK substrates. See Figure 2B for amino acid color-coding. The heat map (2. and 5.) represents the standardized frequencies of the 50 known AMPK substrates, with red indicating enrichment and blue indicating depletion in the AMPK motif compared with background (see Figure S6A).
(B) Ranked list of the scored motifs corresponding to the Group A (yellow lines), B (green lines), and C (blue lines) phosphorylation sites. The logo motif for each quartile of ranked motifs is shown. Scores of interest are noted.
(C) Nine highly scoring Group B and C phosphorylation sites are on proteins with known roles in cell motility, adhesion, and invasion. When combined with Group A, this totals 24 phosphorylation sites on 22 proteins involved in these processes (2 sites are on PPP1R12C and ERBB2IP).

