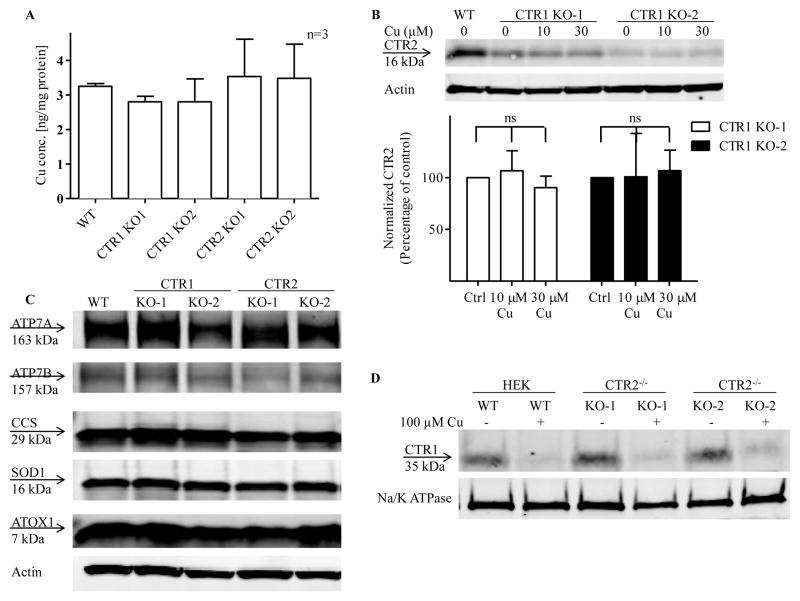
Figure 3.
Cu homeostasis in CTR1 and CTR2 KO cells (A) Whole cell Cu content in CTR1 and CTR2 knockout cells comparing to WT cells. (B) Effect of Cu supplementation on CTR2 protein levels in CTR1 knockout cells. The immunoblot shown is representative of 3 independent experiments. (C) ATOX1, SOD1, CCS, ATP7A and ATP7B protein levels in HEK293T WT, CTR1 and CTR2 KO cells. The immunoblot shown is representative of 3 independent experiments. (D) CTR1 plasma membrane levels and Cu-induced clearance of CTR1 from the plasma membrane of CTR2 KO cells. Vertical, bars, ± SEM

