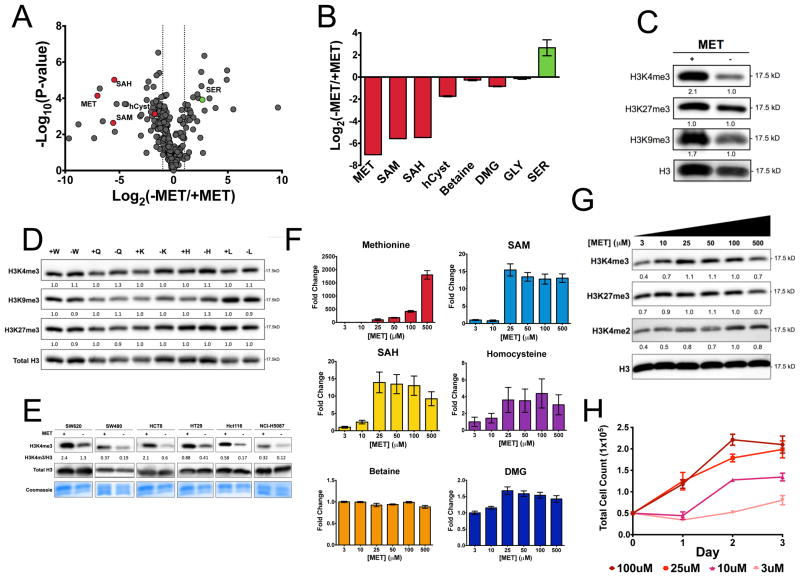
Figure 1. Methionine metabolism alters histone methylation status.
a.) Metabolomics profile of methionine restricted HCT116 cells. Log2 fold change versus –log10(P value) (Student’s t-test two-tailed, n = 3). b.) Effects on methionine restriction on one carbon cycle metabolism. c.) Effects of methionine restriction on histone methylation measured by immunoblotting. Band intensities are normalized to total H3 levels and relative intensity was calculated compared to control cells. d.) Effects of deprivation of other amino acids on histone methylation. Data are normalized to control media. e.) Effects of methionine restriction on histone methylation across a panel of cell lines. f.) Relative concentration of methionine cycle metabolites in cells cultured in different concentrations of methionine. g.) Concentration dependent effects of methionine restriction on histone methylation. Data are normalized to the 100 μm condition. h.) Cell proliferation of HCT116 cells for differing levels of methionine. All error bars are computed from standard error of measurement (n=3) and all quantitation is normalized to the total H3 and the fold change between experimental and control groups are reported.

