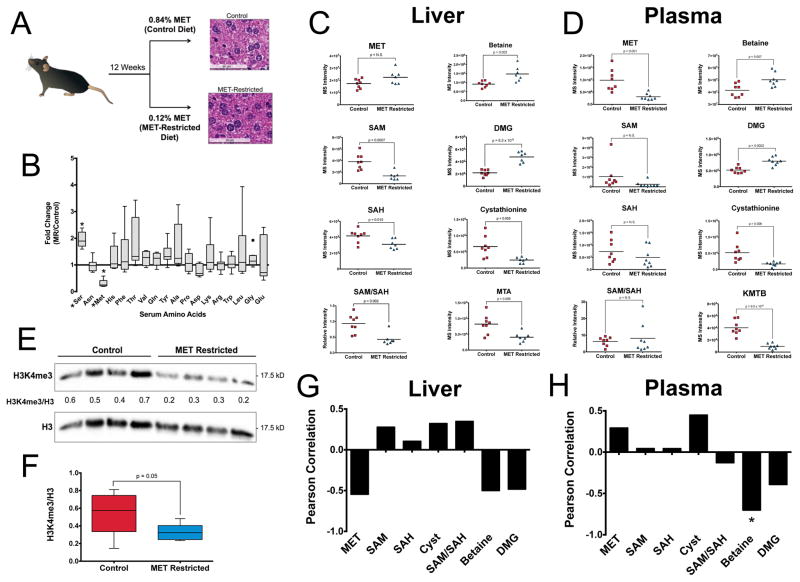
Figure 5. Alterations in methionine metabolism can be sustained by diet in vivo.
a.) Methionine restriction in mice with representative histology in methionine-restricted and control mice. Images are at 40X with Hematoxylin and Eosin staining. b.) Fold change of serum amino acids in −MET compared to +MET, measured my LC-MS (*denotes p<0.001). c.) Methionine cycle metabolites in liver of methionine-restricted mice. d.) Methionine cycle metabolites in plasma of methionine-restricted mice e.) Histone methylation in liver of methionine-restricted mice. Integrated intensities were normalized to total H3 f.) Quantitation of results histone methylation from n=8 mice in each cohort. P value is obtained from a student’s t-test equal variance. g–h) Correlation of histone methylation and methionine cycle metabolites in liver and plasma.

