Figure 3.
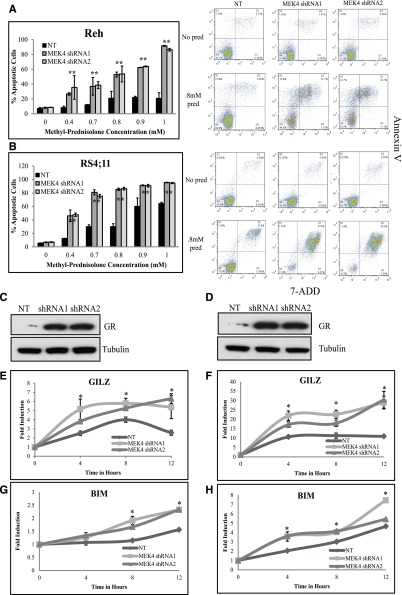
MEK4 knockdown increases prednisolone-induced apoptosis by increasing GR levels. Percentage of apoptotic cells upon prednisolone treatment in control cells compared to MEK4-knockdown Reh (A) and RS4;11 cells (B). Representative scatter plots of annexin V staining (y-axis) and 7-aminoactinomycin D (7-ADD; x-axis) are shown for NT and MEK4-knockdown cells treated with no drug or 0.8 mM of prednisolone (pred) for 24 hours are shown adjacent to the apoptosis bar graphs. Western blot for the GR in control NT and in MEK4-knockdown cell lines Reh (C) and RS4;11 (D). Fold induction of GR target genes GILZ and BIM at 4, 8, and 12 hours after prednisolone exposure in Reh (E,G) and RS4;11 cells (F,H). Mean values of 3 replicate experiments are depicted, with error bars representing standard deviation. *P ≤ .05.

