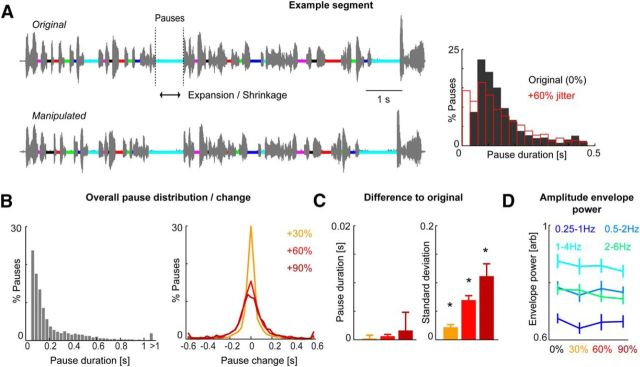
Figure 1.
Manipulation of speech rate. A, The rhythmic structure of speech was characterized by detecting periods of relative silence (termed “pauses”), defined by continuous segments of at least 30 ms of low (<0.1, normalized) amplitude. These are indicated by colored bars on the sound wave. The duration of individual pauses was manipulated by expanding or shrinking each pause by a random duration drawn from a Gaussian distribution with zero mean and defined variance. The resulting manipulation is shown in the bottom panel (matching colors). Right, Distribution of pause duration in one example text (6 min) before (black) and after applying the manipulation (60% jitter; red). B, Distribution of pause duration (left) and change in duration (right) across all 8 6-min texts. C, Changes in mean duration and SD imposed by each level of manipulation expressed as a difference from the original material. For this comparison, each manipulation was applied to the entire text corpus. Bars show the difference across sub-blocks, as used in the experiment (cf. Fig. 2; n = 12; mean and SEM). D, Band-limited power of the speech amplitude envelope for each condition in different frequency bands. Bars show the power across sub-blocks (n = 12; mean and SEM).

