
Figure 2.
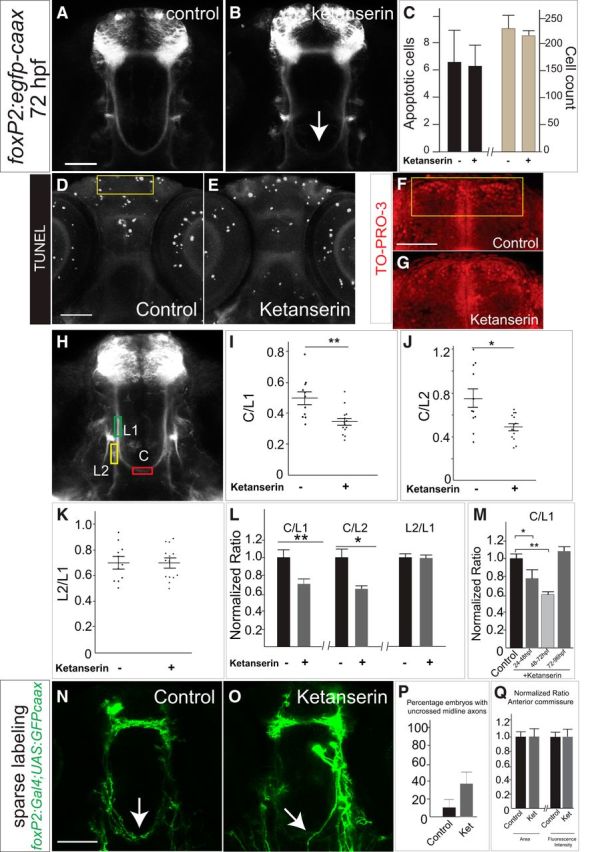
Commissural axon projections of TCPT neurons are disrupted by blockade of 5-HT signaling. A, B, Tg(foxP2-enhancerA.2:egfp-caax) embryos, maximum intensity z-stack projections, α-GFP immunohistochemistry, rostral top. Scale bar, 50 μm. TCPTc midline axon crossing is disrupted (arrow) when treated with ketanserin (B) compared with control (A). C, Ketanserin does not cause increased apoptosis in treated embryos or changes in overall cell counts in the telencephalon, n = 5 each group. Error bars indicate SD (apoptosis) or SEM (cell counts). D, E, Representative TUNEL images used for quantification, confocal z-stacks, rostral top, area for quantification in yellow box. Scale bar, 50 μm. F, G, Representative TO-PRO-3 staining in telencephalon, area for quantification in yellow box. Scale bar, 50 μm. H, Confocal image of Tg(foxP2-enhancerA.2:egfp-caax) embryo showing where measurements were made for the intensity of commissural (C), precrossing longitudinal (L1), and postcrossing (L2) axon tracts (see Materials and Methods for details). I–K, Scatterplots of results from individual embryos showing the distribution of C/L results. n = 11 and 14, respectively, in control and ketanserin-treated groups. *p < 0.05, **p < 0.01; Student's t test. Error bars indicate SEM. I, J, Results of ketanserin-treated compared with control axon pathways showing that, in treated embryos, the C/L ratio was decreased, indicating fewer TCPTc axons crossing the midline. K, No change was seen in the L2/L1 ratios between control and ketanserin-treated embryos, indicating that the misguided axons did not preferentially choose the longitudinal tract. L, Intensity ratio data shown with values normalized to controls. Error bars indicate SEM. M, C/L1 ratios showing effects of different developmental timing exposure of ketanserin. Effects of ketanserin were developmentally maximal from 48 to 72 hpf, whereas treatment with ketanserin from 72 to 96 hpf did not affect the TCPTc. *p < 0.05, **p < 0.01; Student's t test. Error bars indicate SEM. N, O, Confocal images at 72hpf of sparse labeling in embryos transiently injected with plasmids for foxP2-enhancerA.2:Gal4 and UAS:GFP-caax. P, Quantification of sparse labeling: control embryos (n = 10) demonstrate midline crossing that is disrupted by ketanserin (n = 11) Error bars indicate SE of the proportion. Q, Normalized quantification of anterior commissure midline axon crossing area and fluorescence intensity of Tg(foxP2-enhancerA.2:egfp-caax) embryos shows no affect of ketanserin. Error bars indicate SEM.