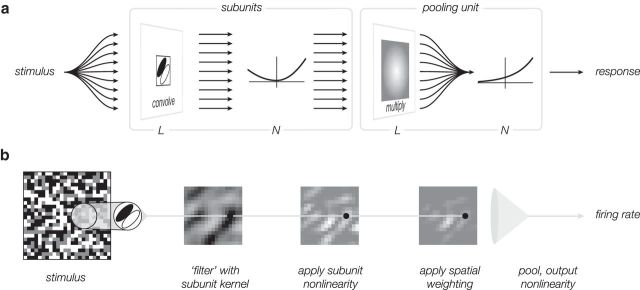
Figure 1.
Subunit model for a single channel. a, A signal flow diagram describes how stimulus information is converted to a firing rate. The stimulus is passed through a bank of spatially shifted, but otherwise identical, linear-nonlinear subunits. The activity of these subunits is combined with a weighted sum over space (and optionally time; not shown), and passed through an output nonlinearity to generate a firing rate. b, Responses of intermediate model stages are depicted for an example input (for simplicity, a single frame is shown, rather than a temporal sequence). Each stage, except for the last, maps a spatially distributed array of inputs to a spatially distributed array of responses, depicted as pixel intensities in an image. The pooling stage sums over these responses and applies the final output nonlinearity.

