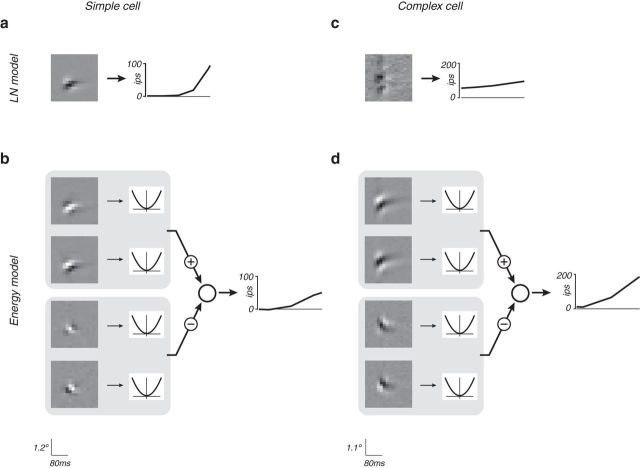
Figure 2.
The LN and energy models fit to space-time (XT) data for an example simple cell and an example complex cell. a, c, LN model. XT filter is depicted as a grayscale image, with intensity indicating filter weight. Oblique filter orientation indicates a preference for moving stimuli (Adelson and Bergen 1985). In this figure and others, the input is in unspecified units, adjusted to span the range of linear responses that arise, given the combination of the experimental stimuli and fitted model parameters. The noisy appearance of the complex cell linear filter is indicative of a poor fit. b, d, Energy model, with two quadrature pairs of filters (one excitatory and one inhibitory). Display contrast for filters is normalized within each model (e.g., the suppressive filters are slightly weaker than the excitatory filters, and thus are plotted with proportionately less contrast). The energy model is invariant to phase, allowing it to capture this property of complex cells, but preventing it from describing simple cells (rsimple = 0.08, rcomplex = 0.41).

