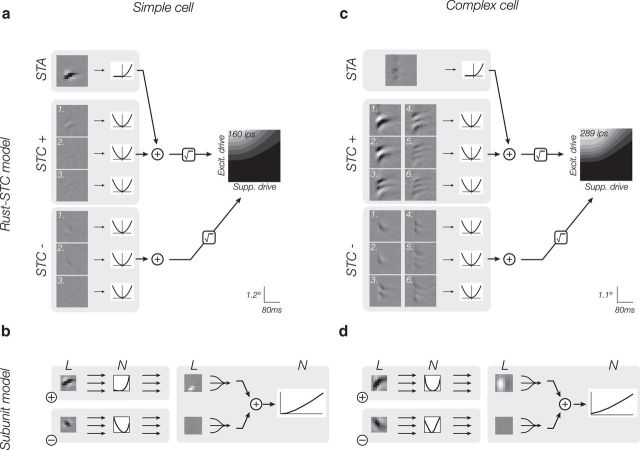
Figure 3.
The Rust-STC and subunit models fit to XT data for the example simple and complex cells of Figure 2. a, c, Rust-STC model. Contrast of individual filters indicates their weighted contribution to the full model. The output nonlinearity is a joint function of the excitatory and suppressive drive (see Materials and Methods) and is depicted as a 2D image in which intensity is proportional to firing rate. Cross-validated model performance: rsimple = 0.56, rcomplex = 0.47. b, d, Subunit model with two channels (excitatory and suppressive). The subunit filters are constrained to have unit norm, but the intensities in the image depicting the linear pooling weights indicate their relative contribution to the response. Cross-validated model performance: rsimple = 0.55, rcomplex = 0.42.

