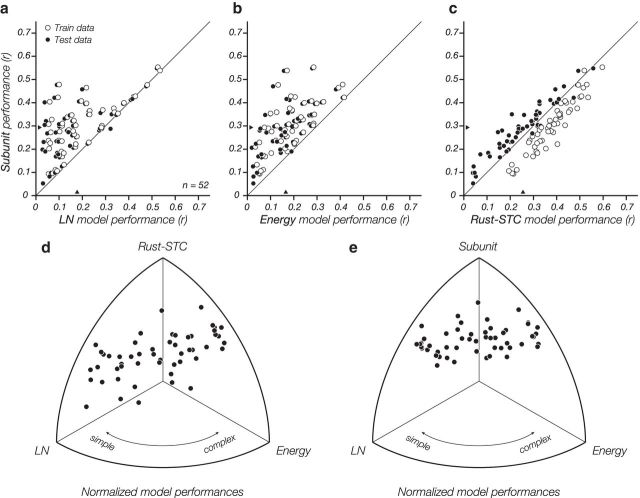
Figure 4.
Comparison of models across all cells fit to space-time (XT) data. Model performance is measured as the correlation between the measured spike count and the model-predicted firing rate. Each point corresponds to a cell, with hollow symbols indicating performance on training data and solid symbols indicating performance on held out testing data (i.e., cross-validated). a, b, The subunit model outperforms both the LN and energy models. c, The subunit model outperforms the Rust-STC model on cross-validated data (solid points), but not on training data (hollow points), a clear indication that the Rust-STC model is overfitting. d, Relative performance of Rust-STC, energy, and LN models, plotted by projecting the 3D vector of r values for each cell onto the surface of the unit sphere. The relative performance of energy versus LN models gives an intrinsic indication of cell complexity. The Rust-STC model outperforms the energy model for most complex cells and has performance approximately comparable with the LN model for simple cells (the LN model is a special case of the Rust-STC model). e, Relative performance of subunit, energy, and LN models. The subunit model consistently outperforms the other models, independent of cell type.

