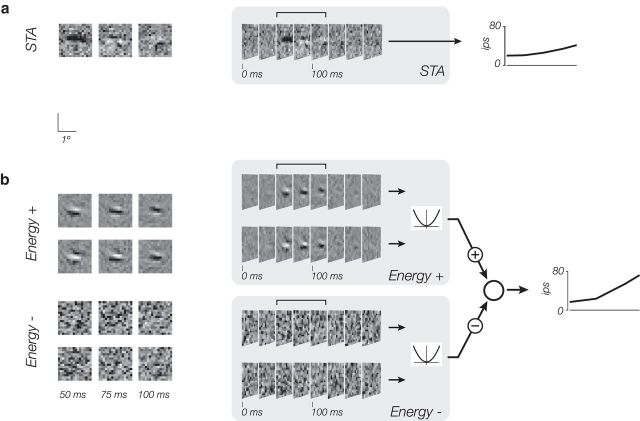
Figure 6.
The LN and energy models fitted to space-space-time (XYT) data from an example complex cell. a, The LN model shows selectivity for spatial patterns over time. The 3D filter kernel is depicted on the right as a stack of spatial filters, each associated with one (25 ms) temporal frame. Three relevant time slices (50, 75, and 100 ms) are replotted on the left for clarity. b, The energy model, with two quadrature pairs of filters (one excitatory, one inhibitory).

