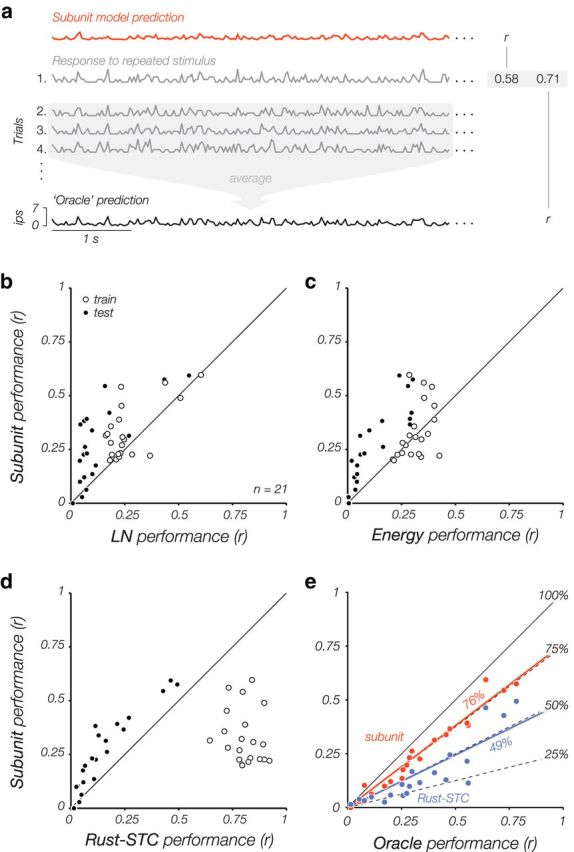
Figure 8.

Comparison of model performances across a subset of XYT cells (n = 21), for which we obtained responses to a 1000-frame stimulus repeated 20 times. a, Model performance is computed as the average correlation (r) between the observed spike count for each of the 20 trials and the model-predicted firing rate. We also computed performance for an “oracle,” which predicts responses on a given trial using a rate estimated by averaging the other 19 trials. This provides an approximate upper-bound on performance of any stimulus-driven model. b–d, The subunit model outperforms all other models on cross-validated testing data (solid), but not on training data (hollow). This indicates significant overfitting for the other models, especially the Rust-STC model. e, Comparison of subunit and Rust-STC models to the oracle. On average, the subunit model (orange points) captures 76% of the variance explained by the oracle, and the Rust-STC model (purple points) captures 49%.
