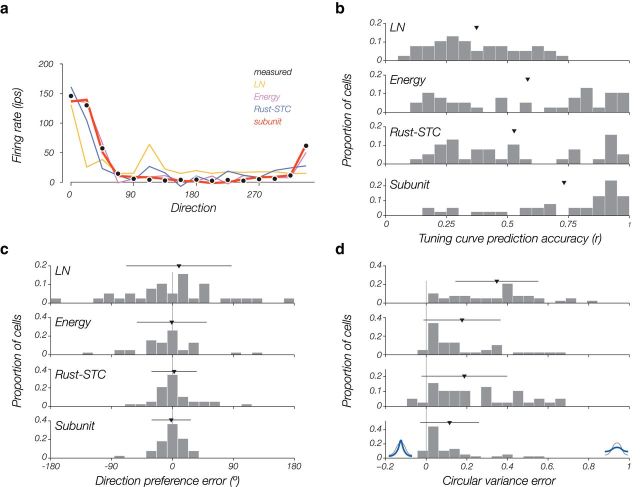
Figure 9.
Predicting responses to drifting gratings. a, Black dots indicate the measured tuning curve for drifting gratings over 16 directions. Colored lines indicate the model-predicted tuning curves for all four model types (model predictions are rescaled for illustration purposes; see Materials and Methods). b, For all cells, we quantify model tuning curve accuracy as the correlation between the actual tuning curve and the model-predicted tuning curve. Here, a histogram is plotted over all cells (n = 38). Triangles represent population means. Error bars (horizontal lines) indicate SD. c, Error in direction preference is smallest for the subunit model, but all models are unbiased in their error. d, Error in circular variance measures the width of the tuning curves (flat curves have a CV of 1). All models tend to predict flatter tuning curves than those measured from drifting gratings, but the subunit model is better than the other models on average. Black and blue curves at the bottom illustrate actual and model predicted tuning curves, respectively.

