Figure 3.
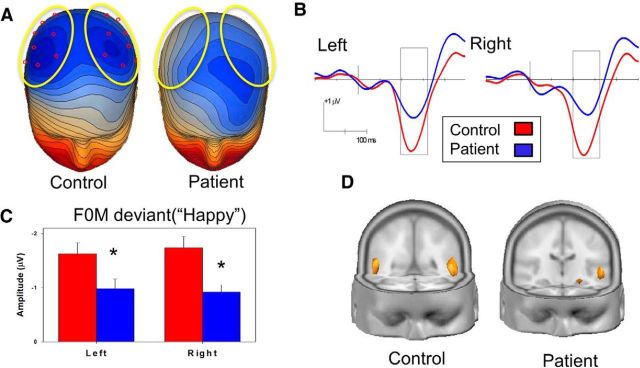
A, Voltage topography maps (130 ms, 0.10 μV/step). Yellow ovals represent electrodes (red) used for statistical analysis. Box represents analyzed latency window (100–160 ms). B, Grand average MMN waveforms for patients (blue) and controls (red) showing MMN_F0M (“Happy”). C, Mean amplitude over 100–160 ms latency window (D): source localization generated in LAURA. Both groups are shown at the same current density (472 μA/mm3). Blue represents patients; red represents controls. *p < 0.05 patients versus controls.

